Confidence scores are useless if they're not calibrated to real-world accuracy.
Many OCR and extraction systems slap a confidence percentage on every output, but these scores are often poorly calibrated. A 95% confidence prediction might only be correct 70% of the time. For enterprise customers automating financial workflows, this gap is unacceptable. You can't build reliable automation on unreliable confidence estimates.
We've built confidence scoring that actually maps to accuracy. When we say 95% confidence, we mean 95% of those predictions are correct in production. This calibration is what enables customers to set meaningful thresholds: auto-process above 90%, flag for review between 70-90%, reject below 70%. Without calibration, those thresholds are meaningless.
The Calibration Problem
Raw model confidence scores reflect the model's internal probability estimates, not real-world accuracy. These estimates are systematically miscalibrated in predictable ways:
Overconfidence: Neural networks are notoriously overconfident. A model that outputs 95% confidence might only be correct 80% of the time. This is especially problematic for out-of-distribution inputs that the model hasn't seen during training.
Underconfidence: Some models, particularly ensembles, can be underconfident on easy cases. A 70% confidence prediction might be correct 95% of the time because the model is hedging unnecessarily.
Non-monotonicity: Higher confidence doesn't always mean higher accuracy. A model might be more accurate at 85% confidence than at 90% confidence due to quirks in its training distribution.
Calibration transforms raw model outputs into scores that actually correspond to expected accuracy. A well-calibrated system has the property that among all predictions with confidence C, approximately C% are correct.
Calibration Methodology
We calibrate confidence scores using held-out validation data with ground truth labels. The process:
1. Collect predictions and outcomes: Run the model on a large validation set, recording raw confidence scores and whether each prediction was correct.
2. Bin by confidence: Group predictions into confidence bins (e.g., 0.90-0.91, 0.91-0.92, etc.). For each bin, compute the actual accuracy.
3. Fit calibration curve: Model the relationship between raw confidence and actual accuracy. We use isotonic regression, which fits a monotonic function without assuming a parametric form.
4. Apply calibration: Transform raw confidence scores through the fitted curve to produce calibrated scores.
The calibration curve might show that raw confidence of 0.95 corresponds to actual accuracy of 0.87. The calibrated score becomes 0.87, giving users an honest estimate of expected correctness.
We measure calibration quality using Expected Calibration Error (ECE):
ECE = Σ (|bin_size| / total) × |accuracy(bin) - confidence(bin)|
Lower ECE means better calibration. A perfectly calibrated model has ECE = 0. We target ECE < 0.02 across all extraction types.
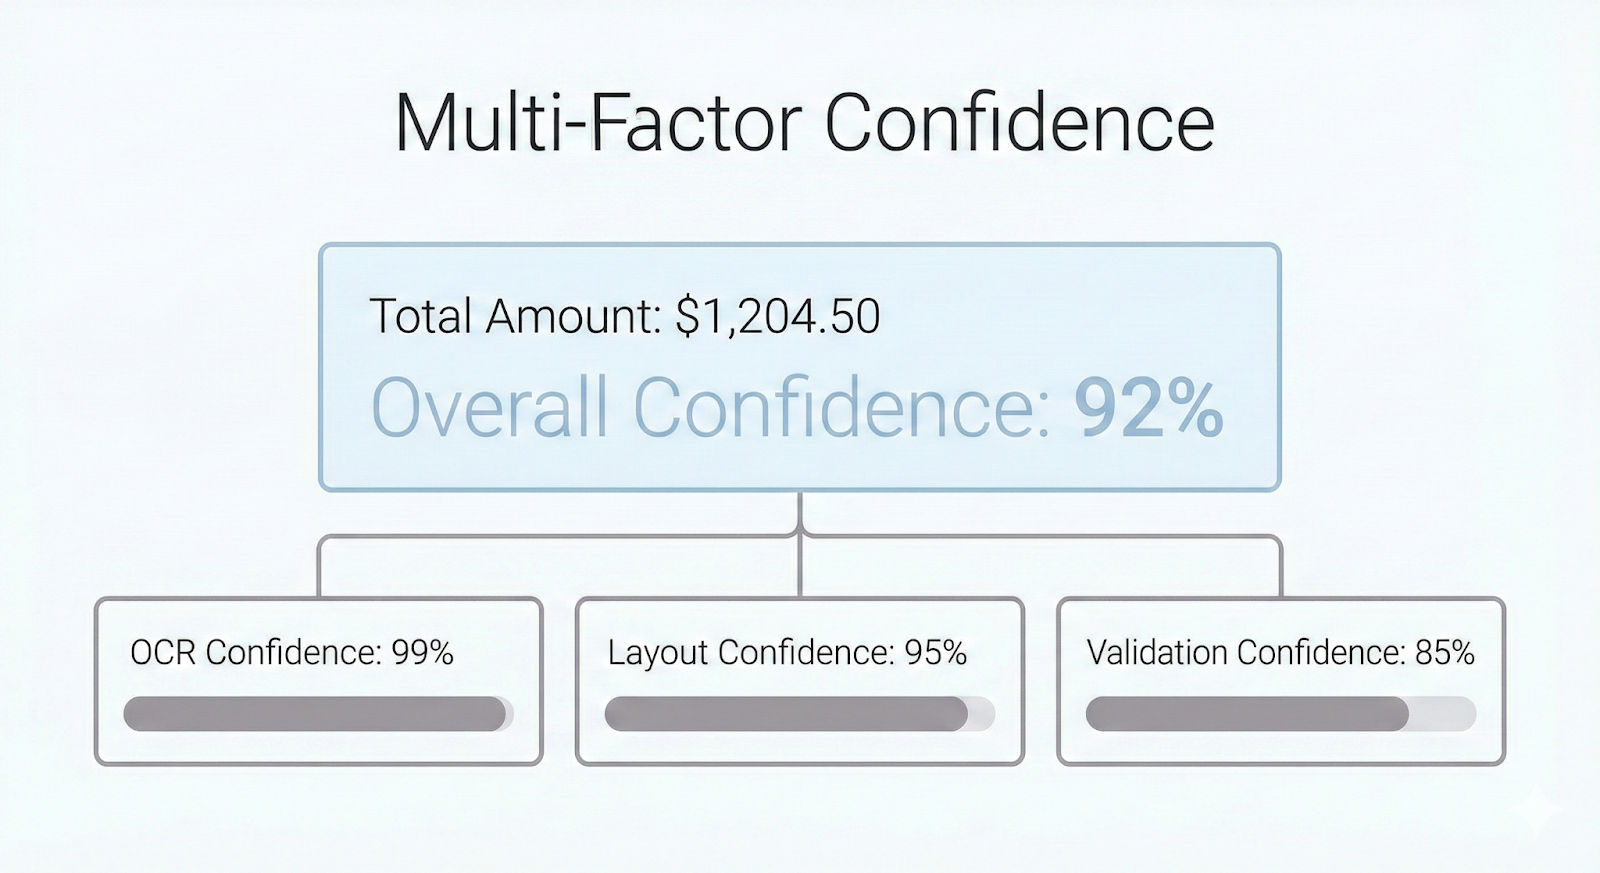
Multi-Factor Confidence
Document extraction involves multiple components, each with its own uncertainty. A single confidence score that blends everything together loses valuable information. We compute and expose confidence at multiple levels:
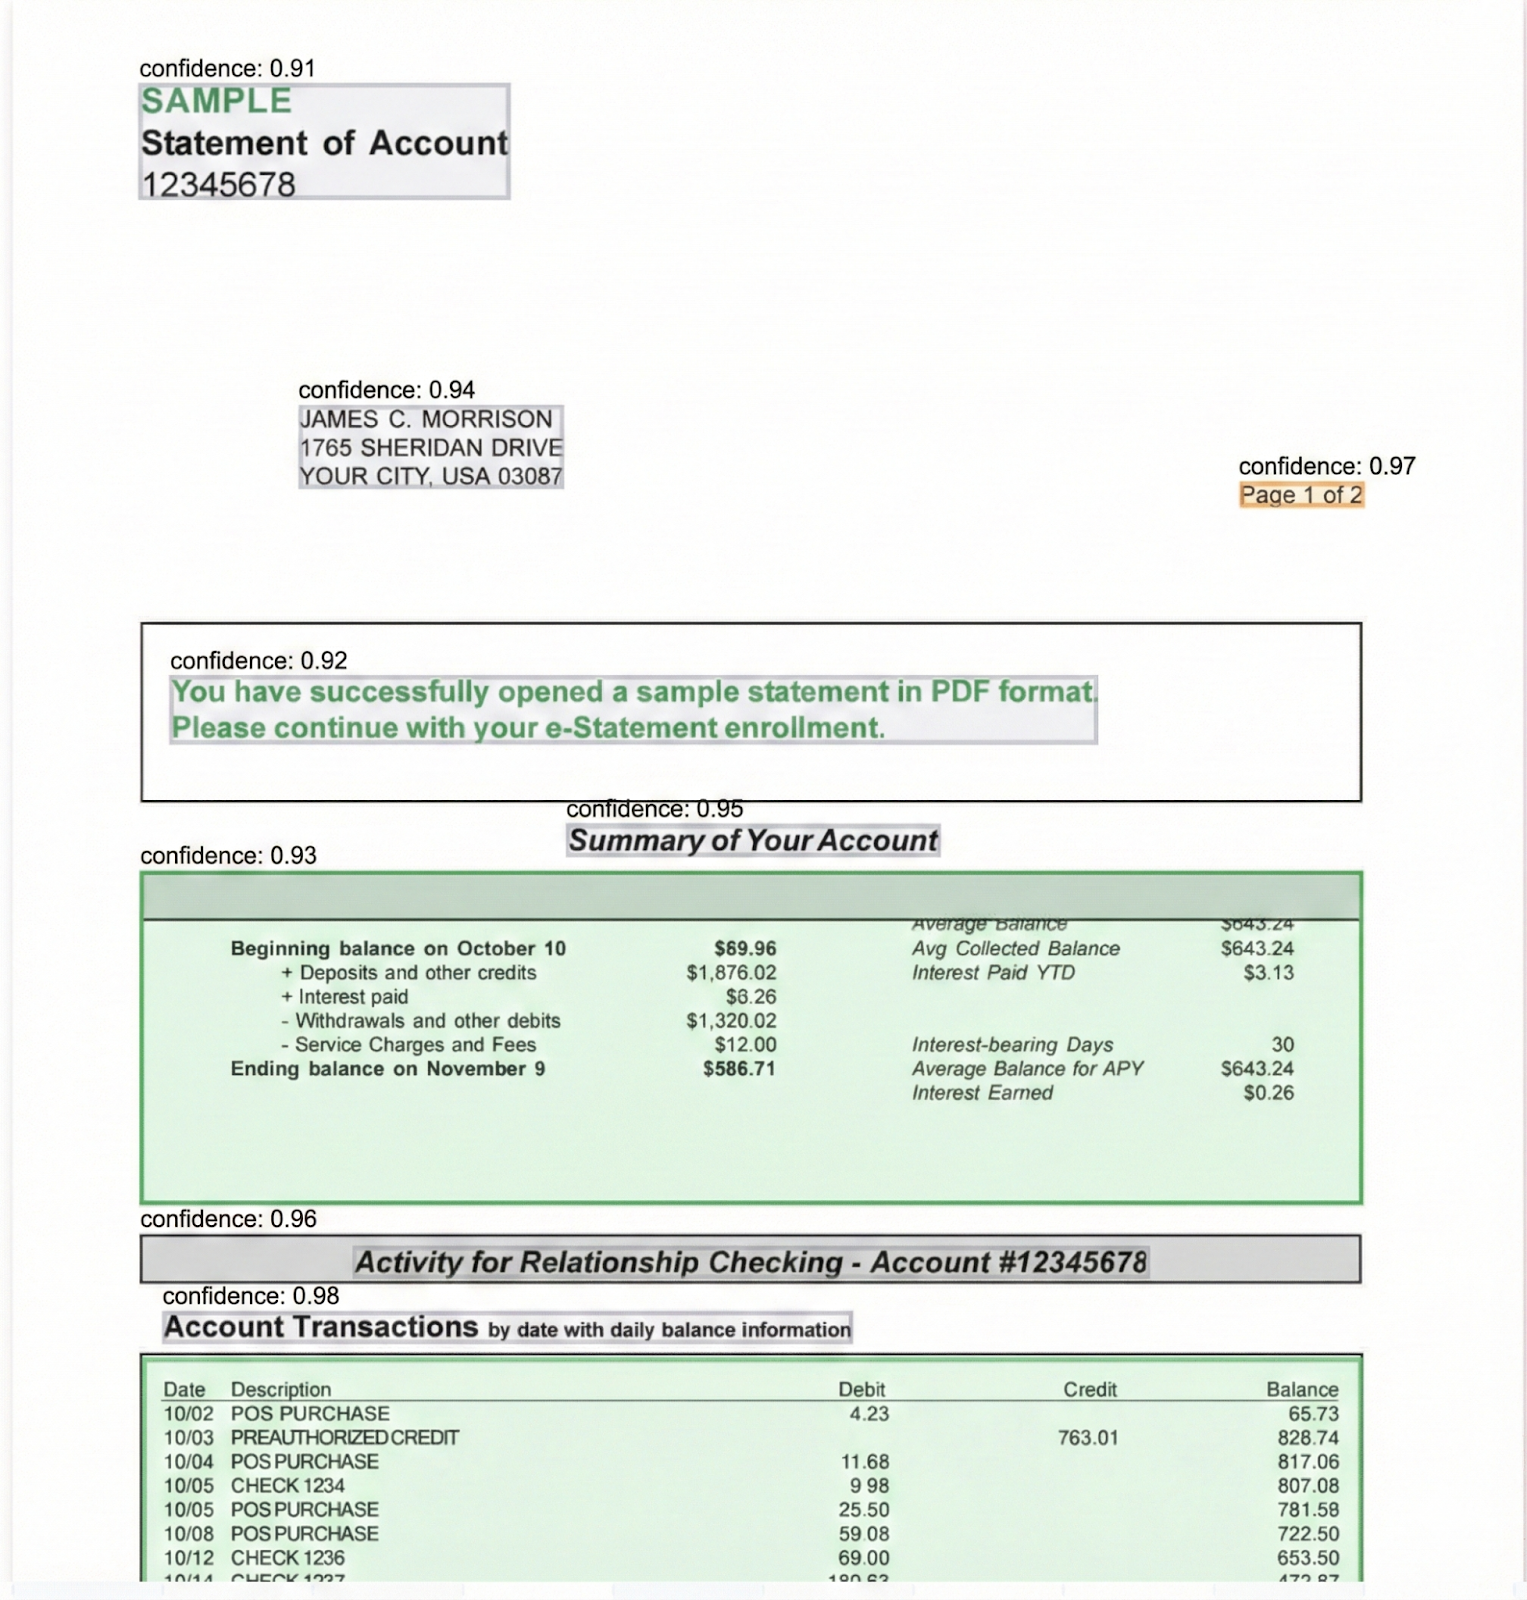
OCR confidence: How certain is the text recognition? This reflects character-level recognition quality, affected by image resolution, font clarity, and noise.
Layout confidence: How certain is the structural detection? This reflects whether tables, cells, and regions were identified correctly.
Extraction confidence: How certain is the field mapping? This reflects whether the extracted value was assigned to the correct field given the detected structure.
Validation confidence: How well does the extraction pass semantic checks? This reflects consistency with expected formats, ranges, and cross-field constraints.
The overall confidence is a function of these components:
overall_confidence = f(ocr_conf, layout_conf, extraction_conf, validation_conf)
But we also expose the components individually. A low overall score with high OCR confidence but low layout confidence tells you the problem is structural detection, not text recognition. This granularity matters for debugging and for designing targeted review workflows.
Confidence by Extraction Type
Different extraction types have different accuracy profiles. Handwritten text is harder than printed text. Nested tables are harder than simple tables. We maintain separate calibration curves for each extraction type:
A single global calibration curve would blur these differences. Type-specific calibration lets users set different thresholds for different content: auto-accept printed text at 85%, but require review for handwritten text below 95%.
Ensemble Disagreement as Signal
When multiple models or extraction methods are available, their agreement (or disagreement) provides additional confidence signal.
We run parallel extraction paths where feasible:
- Multiple OCR engines on the same region
- Template-based extraction alongside model-based extraction
- Different model architectures (CNN-based vs. transformer-based)
Agreement across methods increases confidence. Disagreement decreases it:
if all_methods_agree:
    confidence_boost = +0.05
elif majority_agree:
    confidence_boost = 0
else:
    confidence_penalty = -0.10 to -0.20 (based on disagreement severity)
This ensemble signal catches cases where a single model is confidently wrong. If three methods agree on "1,234" but one insists on "1,284", the disagreement flags the extraction for review even if the majority answer has high individual confidence.
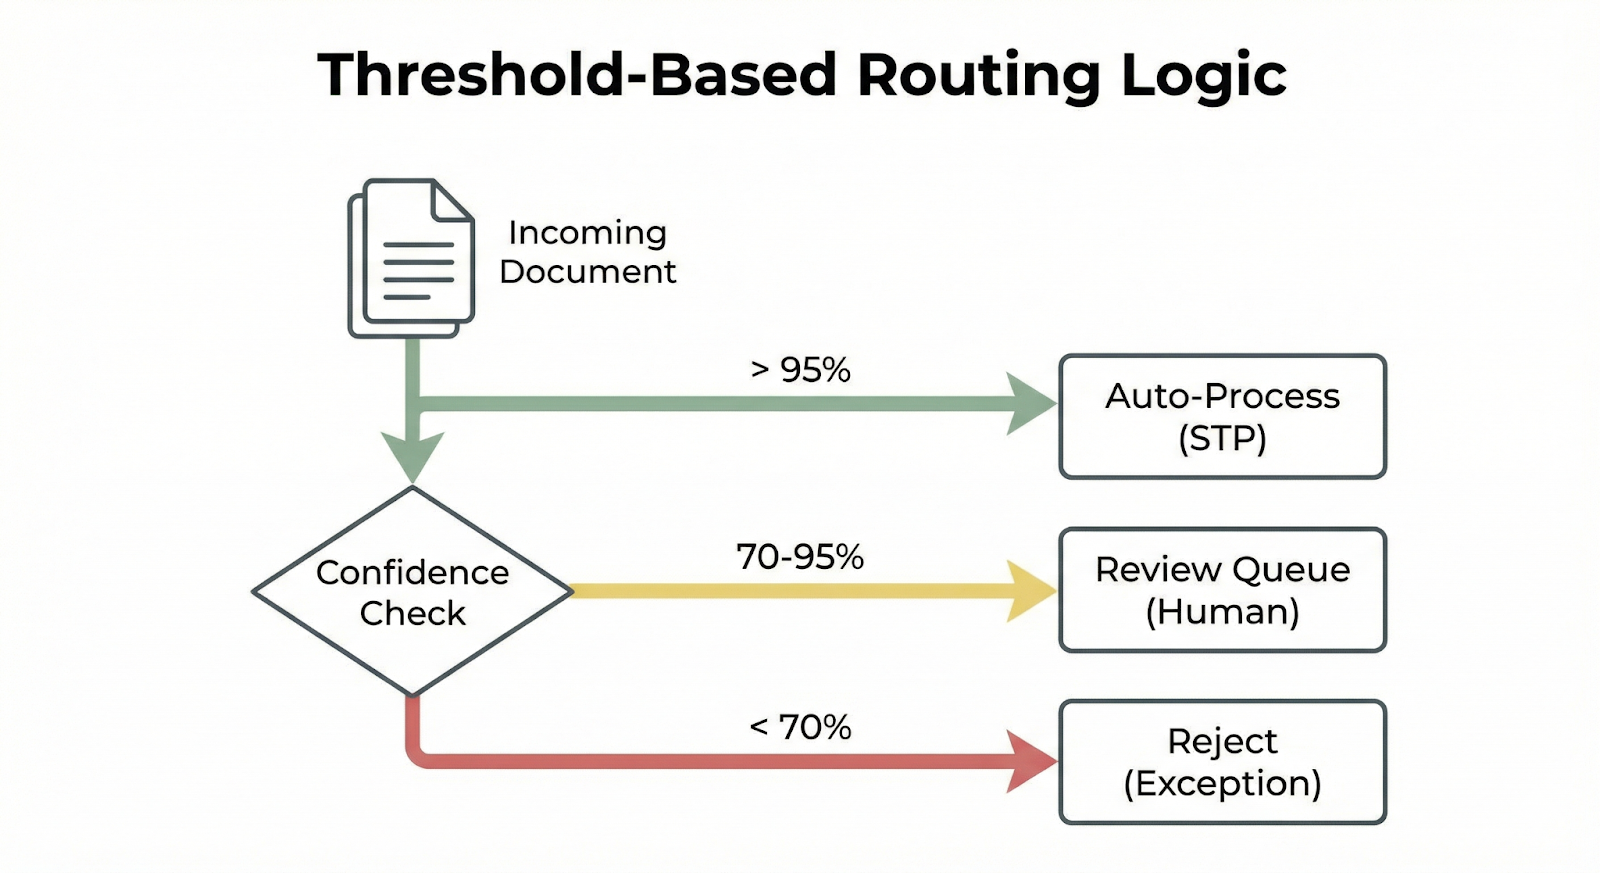
Threshold-Based Routing
Calibrated confidence enables meaningful automation thresholds. We support configurable routing rules:
routing_rules:
  - condition: confidence >= 0.95
    action: auto_accept

  - condition: confidence >= 0.85 AND confidence < 0.95
    action: auto_accept_with_audit_sample
    sample_rate: 0.05

  - condition: confidence >= 0.70 AND confidence < 0.85
    action: route_to_review
    priority: normal

  - condition: confidence >= 0.50 AND confidence < 0.70
    action: route_to_review
    priority: high

  - condition: confidence < 0.50
    action: reject
    reason: low_confidence
These thresholds translate directly to business outcomes:
- Auto-accept at 95%: Expected error rate of 5%. For 100,000 documents, roughly 5,000 errors pass through.
- Review at 70-85%: Concentrate human attention where it matters most.
- Reject below 50%: Don't waste review time on likely garbage.
Customers tune these thresholds based on their error tolerance and review capacity. A workflow that can tolerate 2% error rate sets a higher auto-accept threshold than one requiring 0.1% error rate.
The review interface highlights low-confidence fields, so reviewers focus on uncertain extractions rather than re-checking everything.
Per-Document-Type Calibration
Document types have different difficulty profiles. A standard W-2 form is much easier to extract than a handwritten medical record. Global calibration curves blur these differences.
We maintain separate calibration curves per document type:
calibrated_confidence = calibration_curve[document_type](raw_confidence)
This means 90% confidence on a W-2 and 90% confidence on a complex contract both actually correspond to 90% expected accuracy, even though the raw model scores required to achieve that calibrated level are different.
New document types start with a generic calibration curve, then get type-specific curves as we accumulate enough labeled data (typically 500+ documents with ground truth).
Monitoring Calibration Drift
Calibration degrades over time. Document populations shift, model behavior drifts, and the calibration curves become stale.
We monitor calibration continuously in production:
Spot-check sampling: Random sample of auto-accepted extractions gets human review. Compare actual accuracy to predicted confidence.
ECE tracking: Compute ECE weekly on the spot-check sample. Alert if ECE exceeds threshold (0.03).
Per-type monitoring: Track calibration quality separately for each document type and extraction type.
Confidence distribution shifts: Monitor the distribution of confidence scores. A sudden shift (e.g., average confidence drops from 0.88 to 0.82) signals something changed.
When calibration drift is detected, we retrain the calibration curves on recent data. This typically happens quarterly, or more frequently if significant drift is detected.
The Human-in-the-Loop Interface
Confidence scores ultimately serve the humans who review flagged extractions. The review interface exposes confidence information to help prioritize and focus attention:
Confidence highlighting: Low-confidence fields are visually highlighted in the review UI. Reviewers can focus on uncertain extractions rather than re-checking everything.
Confidence breakdown: Hover to see component scores (OCR, layout, extraction, validation). Helps reviewers understand why a field was flagged.
Sorted by uncertainty: Review queues sort by confidence ascending, so the most uncertain (and most likely wrong) extractions get attention first.
Batch actions by confidence band: Accept all extractions above a threshold with one click, then focus review time on the uncertain remainder.
This integration means calibrated confidence directly reduces review time. Instead of reviewing 100% of extractions, reviewers focus on the 10-15% that actually need attention.
Business Impact
Good confidence scoring has measurable business impact:
Review cost reduction: Calibrated thresholds mean fewer unnecessary reviews. A 10% reduction in review volume at 10,000 documents/day saves significant labor cost.
Error rate control: Predictable accuracy at each threshold means predictable downstream error rates. Finance teams can quantify and plan for expected exceptions.
SLA compliance: Confidence-based routing ensures high-priority or high-risk documents get appropriate attention without manual triage.
Continuous improvement: Confidence monitoring identifies which document types or extraction types need model improvements, focusing engineering effort where it matters.
The goal isn't perfect extraction (that's not achievable). The goal is predictable extraction where you know what you're getting and can build reliable automation on top of it.
--
Want confidence scores you can actually trust? Talk to us about how Pulse delivers calibrated confidence for enterprise automation.