Introducing PulseBench-Tab: A Frontier Benchmark for Table Parsing
Sid and Ritvik
April 22, 2026
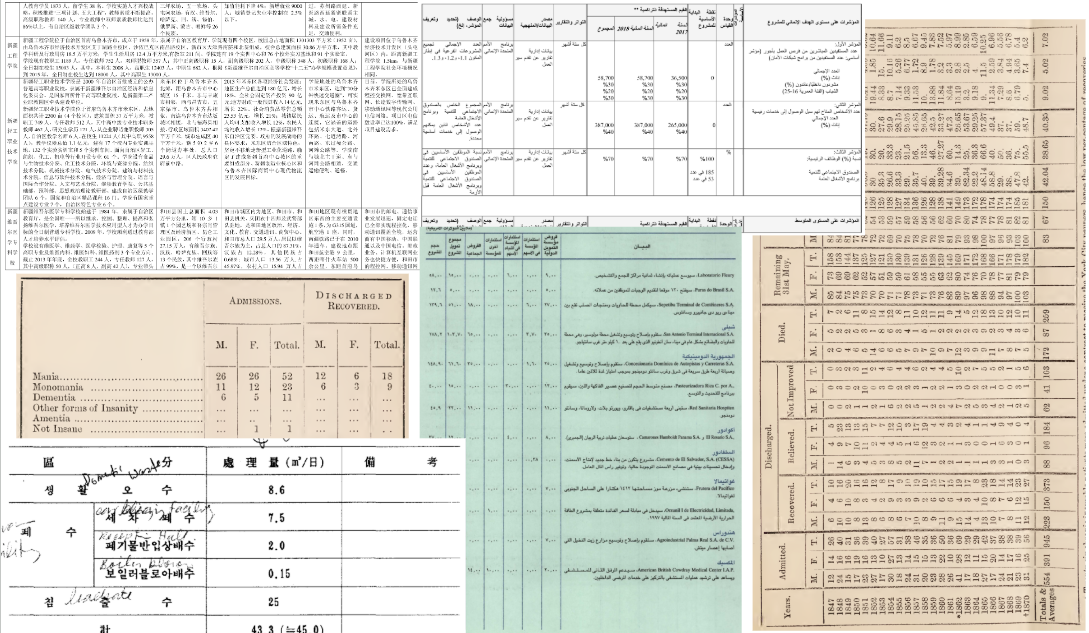
We're announcing PulseBench-Tab, a frontier open-source benchmark focused on table extraction. PulseBench-Tab is a multilingual benchmark with 1,820 human-annotated tables across 9 languages, each presenting its own set of challenges: handwriting, rotations, low-fidelity scanned images, and more. Alongside the dataset, the Pulse research team developed a novel scoring metric (T-LAG) that captures structural accuracy and OCR quality in a single unified score.
Existing table extraction benchmarks primarily evaluate cell-level text matching or sequence alignment, missing the structural relationships (rowspan, colspan, adjacency) that define whether a table was actually understood. T-LAG addresses this gap. We believe having a rigorous eval methodology is the foundation for measuring real downstream impact in document parsing systems.
The Pulse team worked with a dedicated data labeling team, curated with subject matter experts experienced across target languages and HTML table structures. Each table has a ground truth annotation in HTML with full structural markup (rowspan, colspan, thead, tbody). The dataset contains 1,820 table images across 380 unique source documents, across 9 languages and 4 scripts (Latin, CJK, Arabic, Cyrillic).
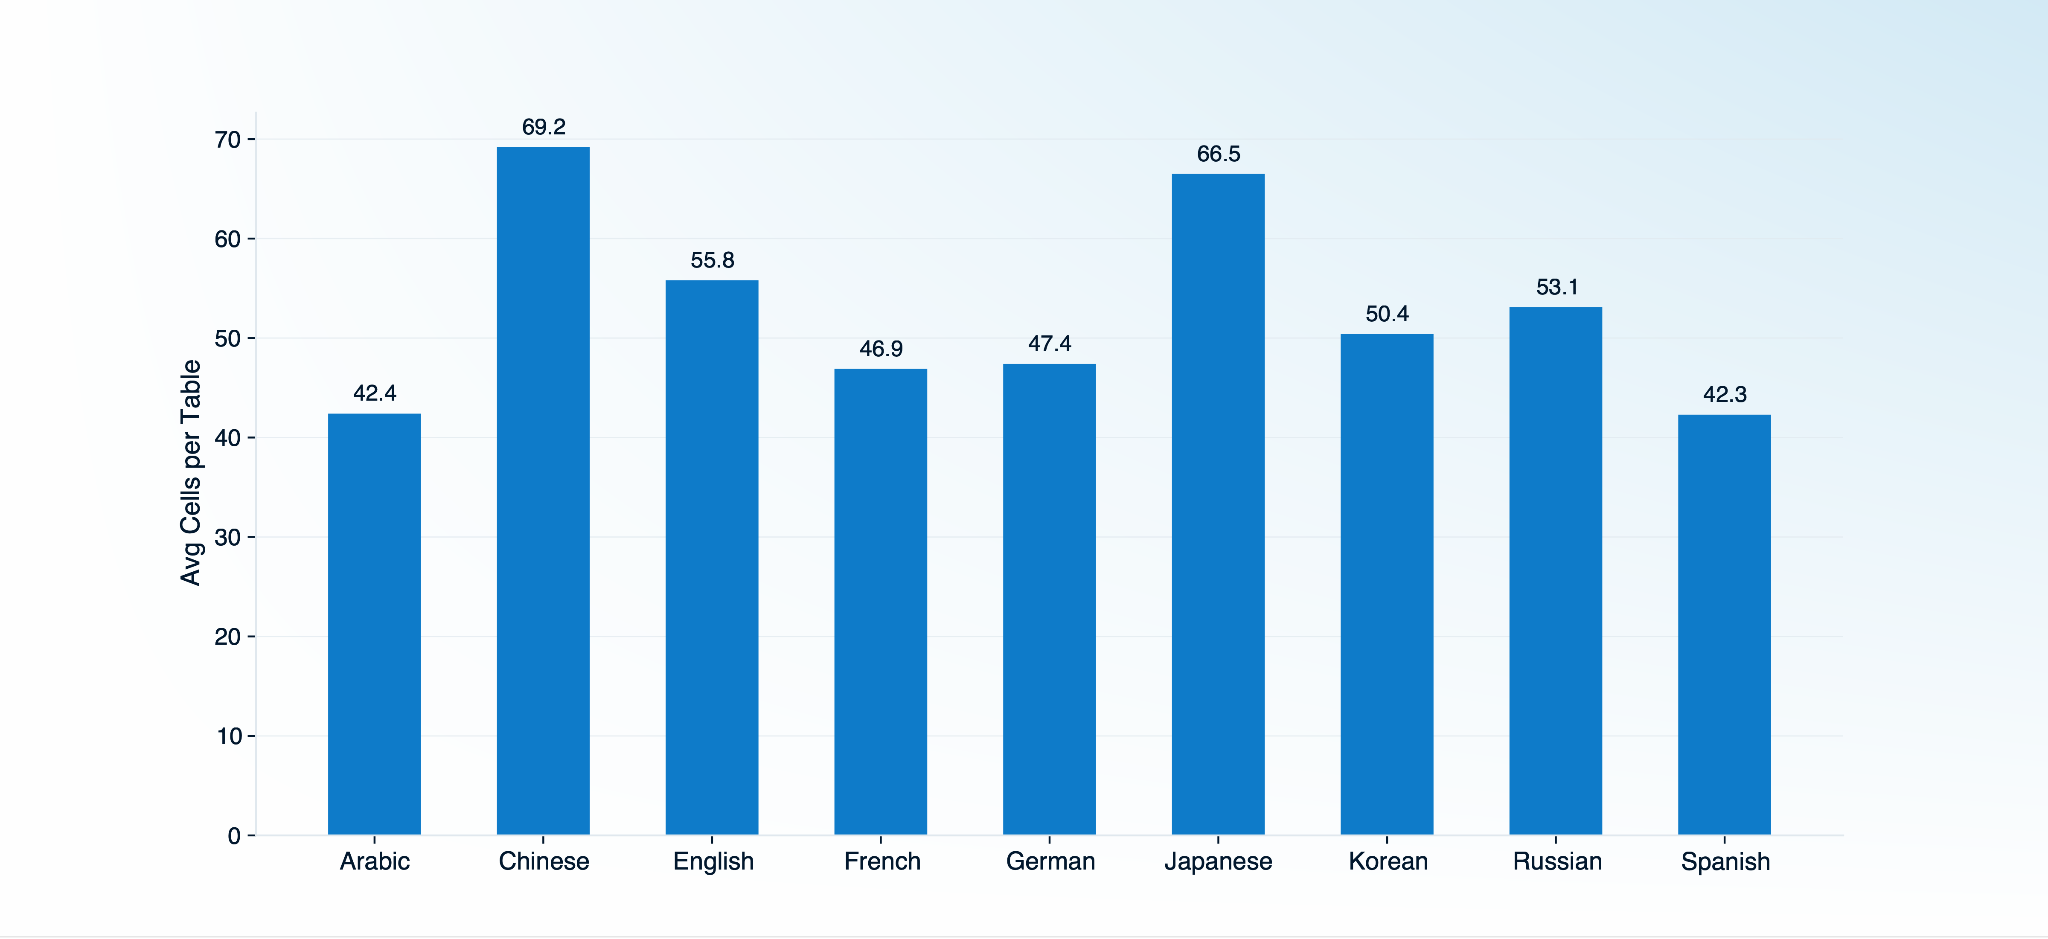
The ground truth images range in complexity, with up to a thousand cells per table and 48.1% of samples containing merged and spanning cells.
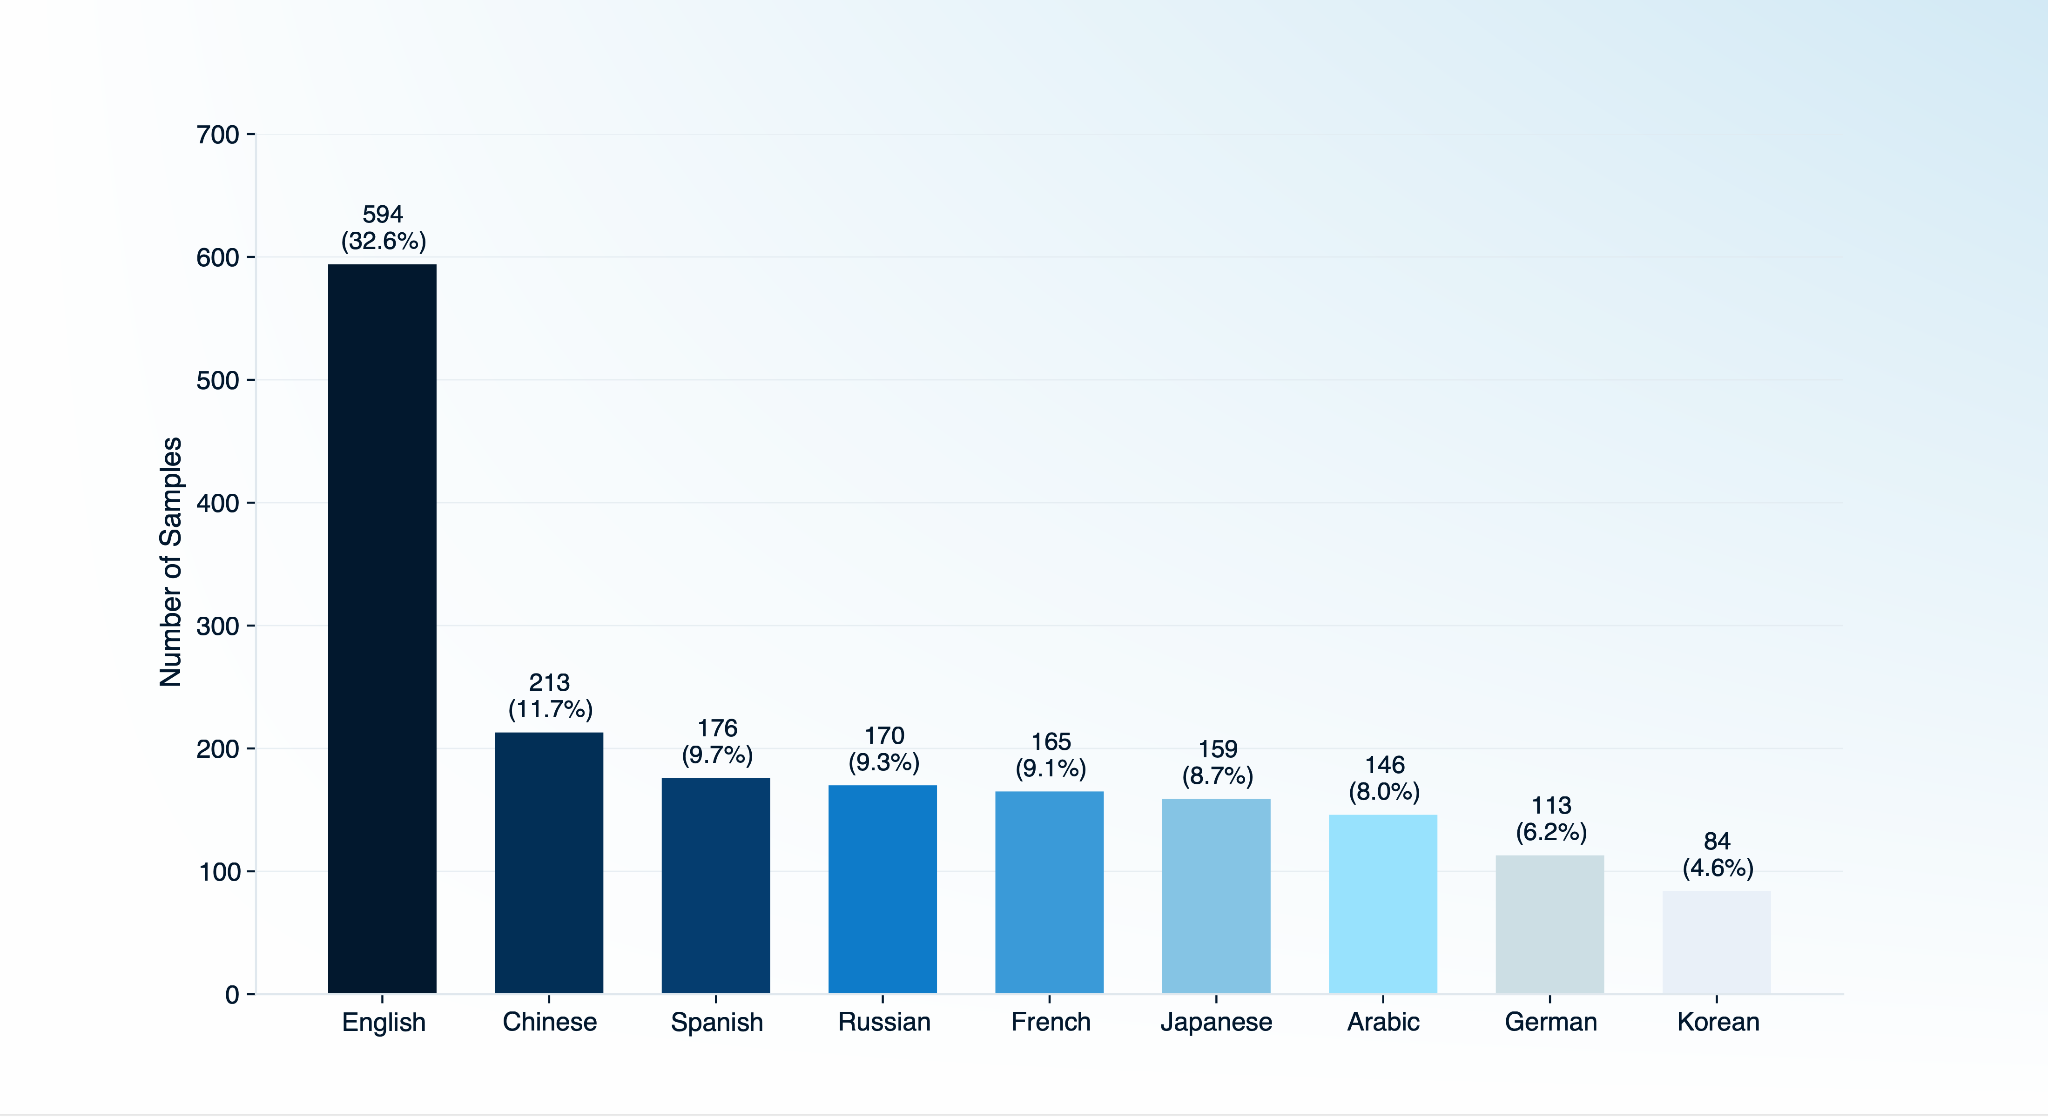
Below is the language distribution across the dataset.
Language
Samples
% of Dataset
English
594
32.6%
Chinese
213
11.7%
Spanish
176
9.7%
Russian
170
9.3%
French
165
9.1%
Japanese
159
8.7%
Arabic
146
8.0%
German
113
6.2%
Korean
84
4.6%
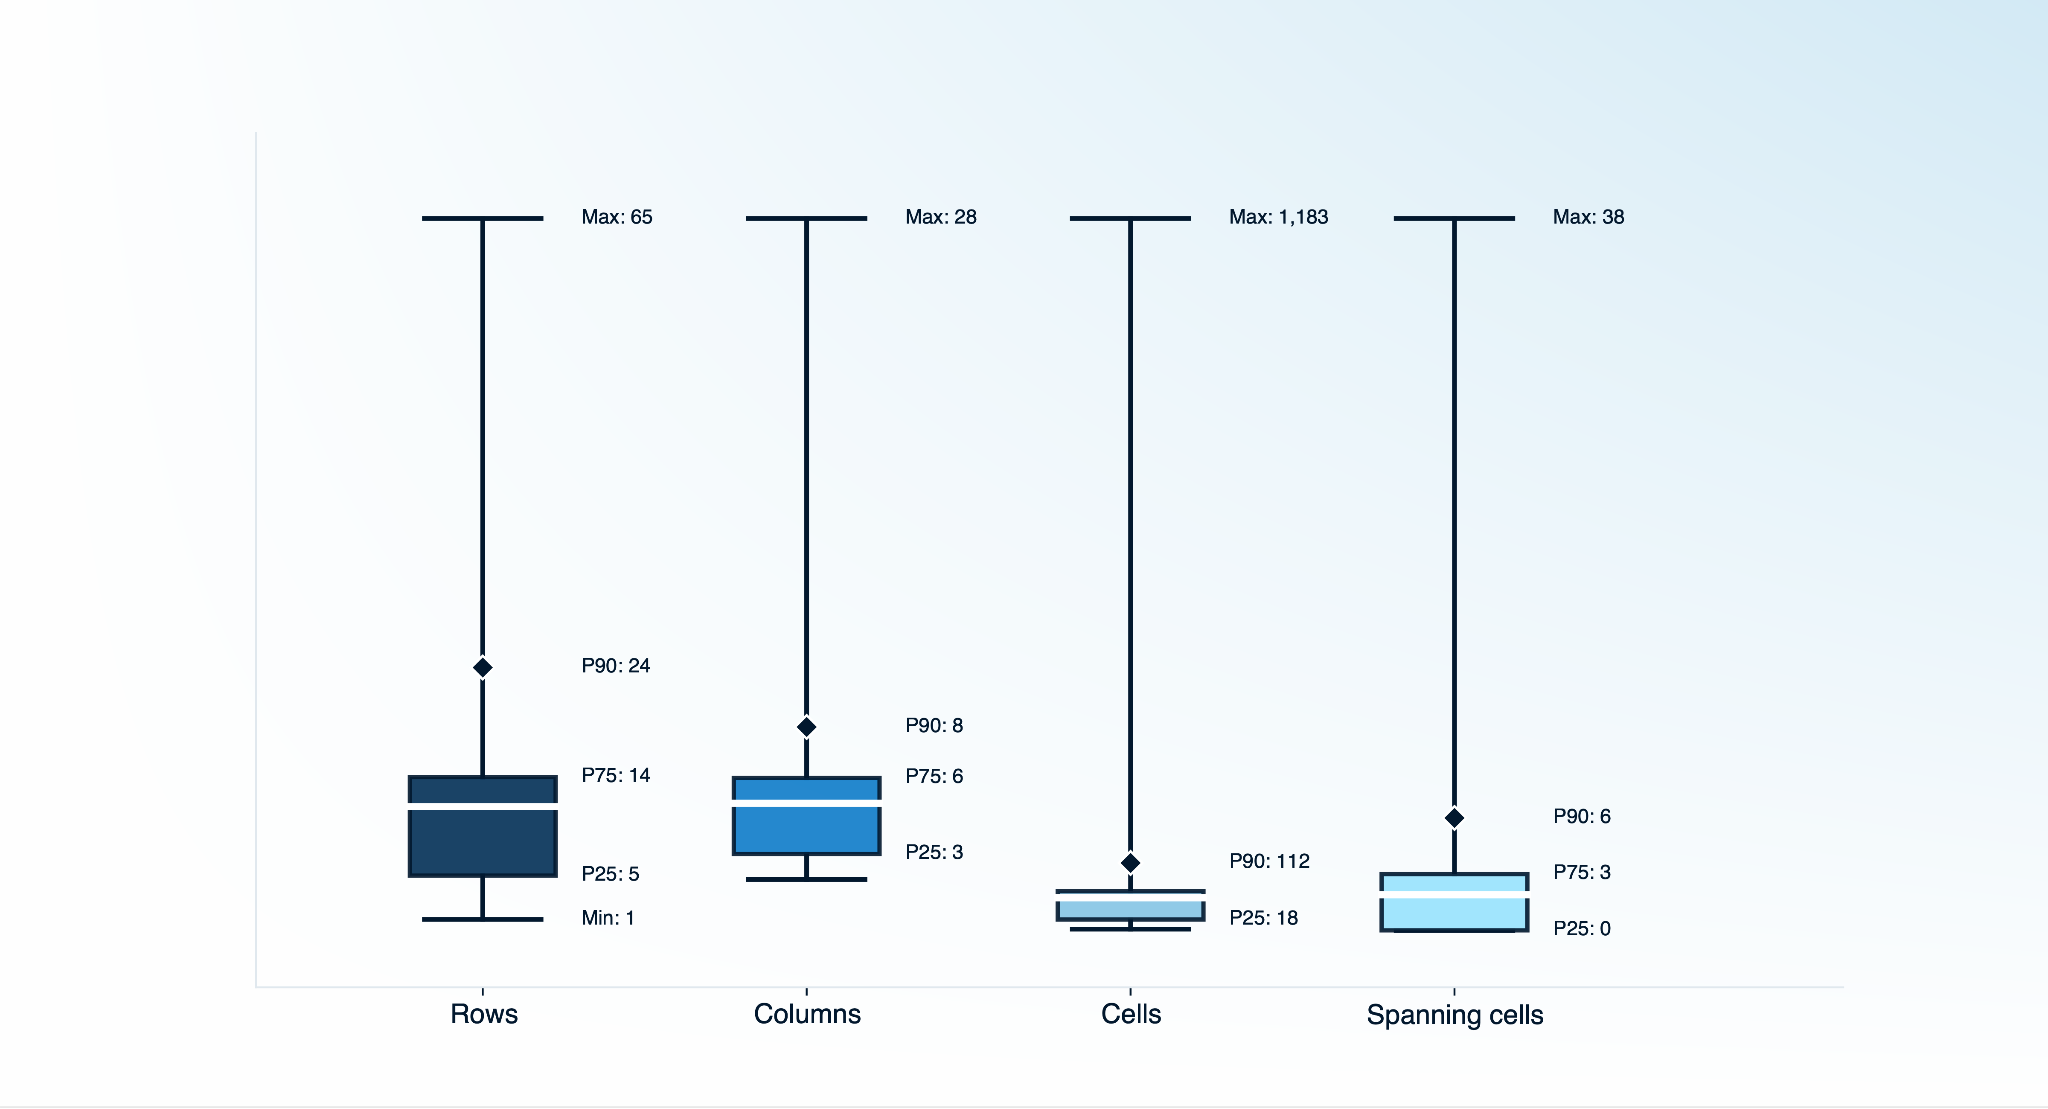
Below is a summary of table complexity across the dataset with numerics on rows, columns, and spanning cells.
Metric
Mean
Min
Max
P25
P75
P90
Rows
11.3
1
65
5
14
24
Columns
5.0
2
28
3
6
8
Cells
54.1
2
1,183
18
65
112
Spanning cells
1.9
0
38
0
3
6
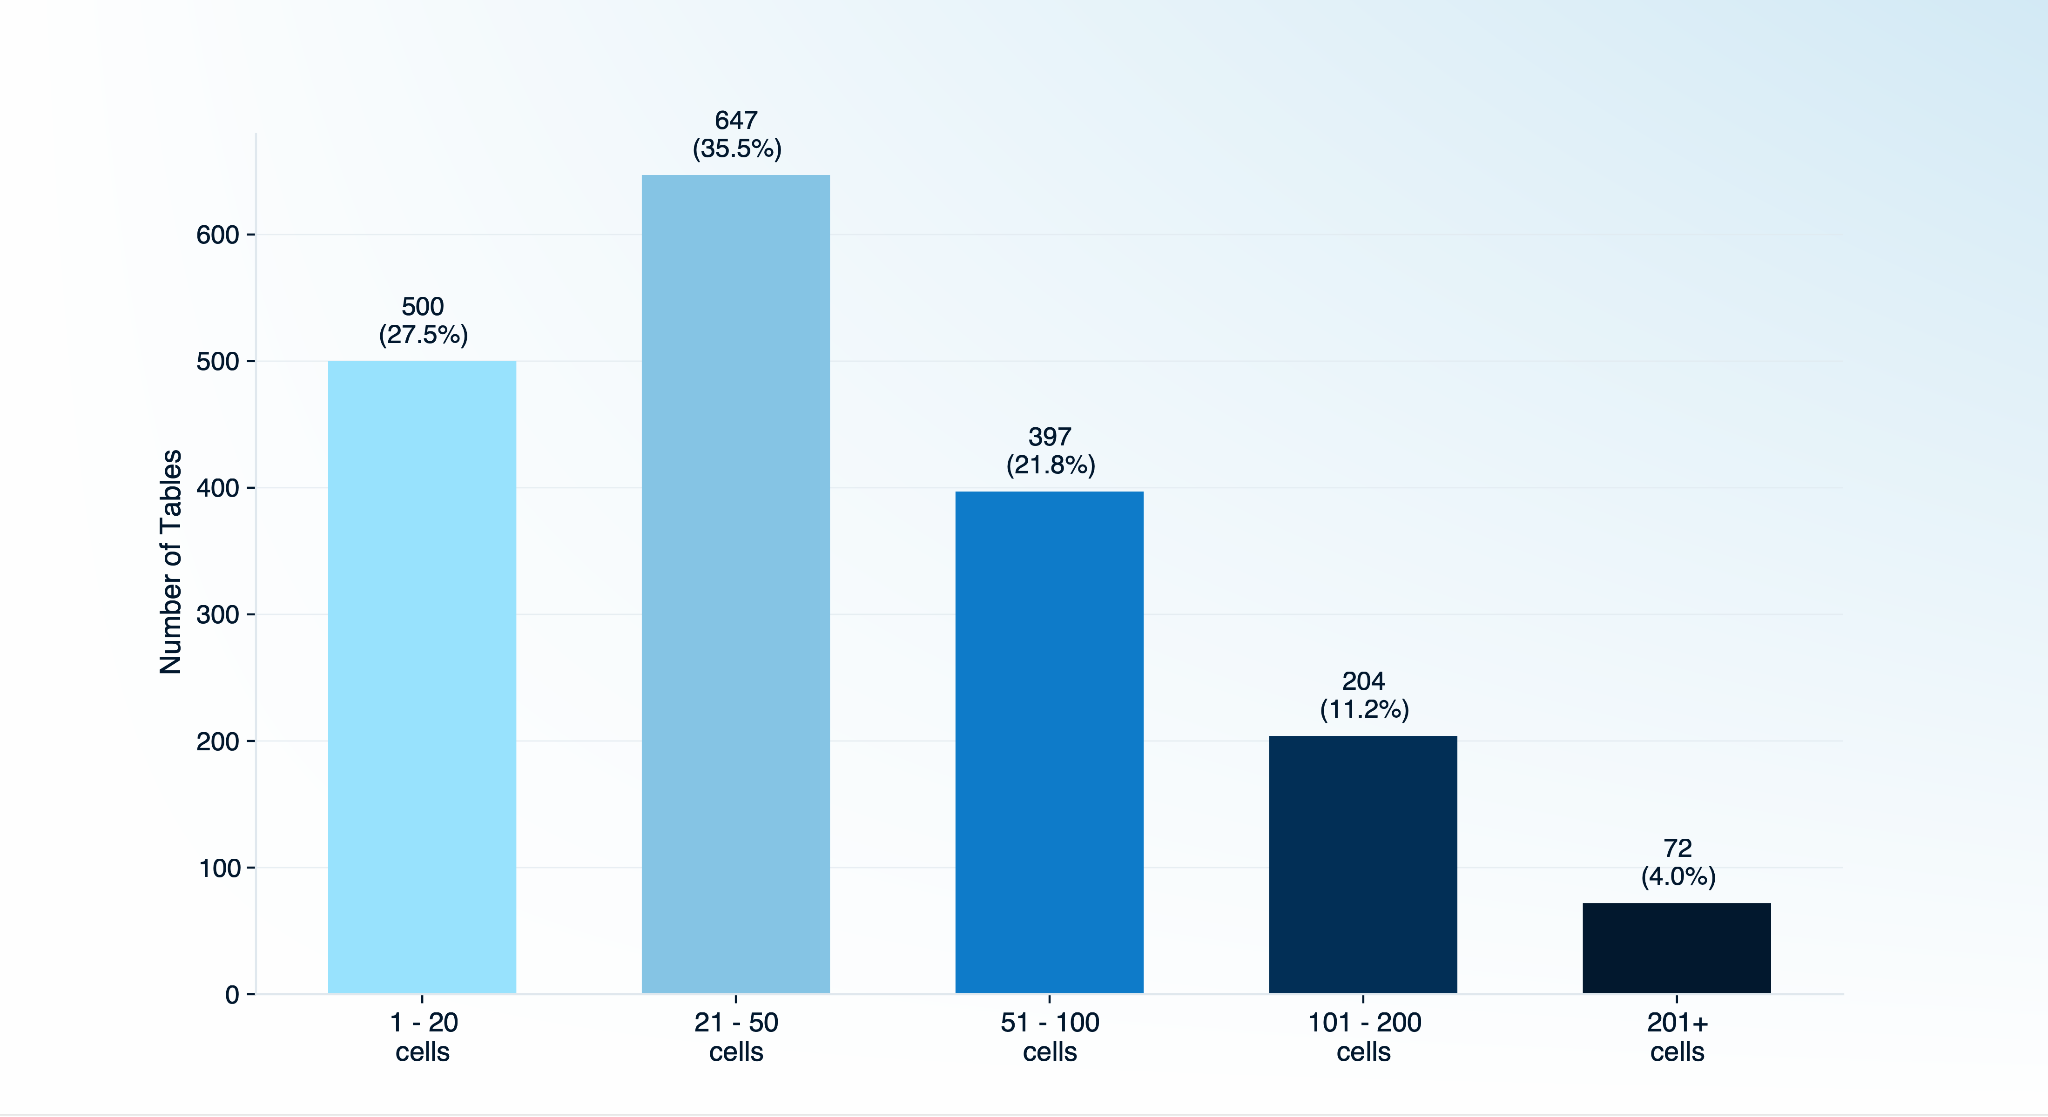
Tables range from simple (27.5% have 20 cells or fewer) to highly complex (4.0% exceed 200 cells), providing coverage across the difficulty spectrum teams encounter in production.
Cell Count
Samples
% of Dataset
1-20
500
27.5%
21-50
647
35.5%
51-100
397
21.8%
101-200
204
11.2%
201+
72
4.0%
Source documents include financial filings, government reports, corporate disclosures, and regulatory filings across all 9 languages.
Evaluation Methodology
The Pulse research team developed T-LAG (Table Logical Adjacency Graph) to measure table extraction quality. Unlike existing metrics that rely on cell-level text matching or hierarchical sequence alignment, T-LAG evaluates structure and content in a single unified score. Full mathematical details are in our research paper: research report.
Step 1: Mapping HTML table to a 2D directed graph
We start by laying out every cell on a grid so we know exactly where it sits. Both the ground truth and prediction HTML tables are parsed into a cell-position grid matrix, preserving all rowspan and colspan attributes. Spanning cells occupy multiple grid positions sharing the same ID.
Step 2: Extract Directed Edges
Next, we connect each cell to its neighbors to capture the table's structure as a graph. T-LAG generates directed edges with the following calculation:
RIGHT edge: cell at $(r, c) \rightarrow$ cell at $(r, c+1)$, if they are different cells
BELOW edge: cell at $(r, c) \rightarrow$ cell at $(r+1, c)$, if they are different cells
Edges within spanning cells are suppressed (same cell ID on both sides). Edges are deduplicated by (source_id, target_id, direction).
Step 3: Weigh Edges via Ψ Function
Now we measure how similar each predicted edge is to each ground truth edge by comparing the text on both ends. For every candidate pair of ground truth edge $e_{gt}$ and predicted edge $e_{pred}$ sharing the same direction, we compute a similarity weight based on how closely the text in the connected cells matches:
The Ψ function (text similarity kernel) works as follows:
Both texts are normalized: strip leading and trailing whitespace, normalize dashes, and collapse internal whitespace.
Null markers (empty string, -, --, ---, ..., n/a, na, none, nil) are mapped to a sentinel value [NULL].
Matching rules are defined as:
$$\Psi(a, b) = \begin{cases} 1.0 & \text{if } a = b = \texttt{[NULL]} \\ 0.0 & \text{if exactly one of } a,\, b \text{ is } \texttt{[NULL]} \\ \left(1 - \dfrac{d_{\text{Lev}}(a, b)}{\max(|a|,\, |b|)}\right)^{\!7} & \text{otherwise} \end{cases}$$
where $d_{\text{Lev}}(a, b)$ is the Levenshtein edit distance between strings $a$ and $b$.
Step 4: Hungarian Matching
With all the similarity scores in hand, we find the best possible one-to-one pairing between predicted and ground truth edges. We build a weight matrix $W$ between all ground truth edges and predicted edges, with cross-direction entries set to zero. The Hungarian algorithm is run on the weight matrix for optimal one-to-one assignment maximizing total matched weight.
Properties:
Optimal: globally optimal assignment, not greedy
One-to-one: no double counting
Direction-aware: RIGHT edges only match RIGHT, BELOW only matches BELOW
Step 5: Score
Finally, we use the total matched weight to compute precision, recall, and an F1 score (unified T-LAG accuracy). Let $S$ denote the total matched weight from the Hungarian assignment. Then:
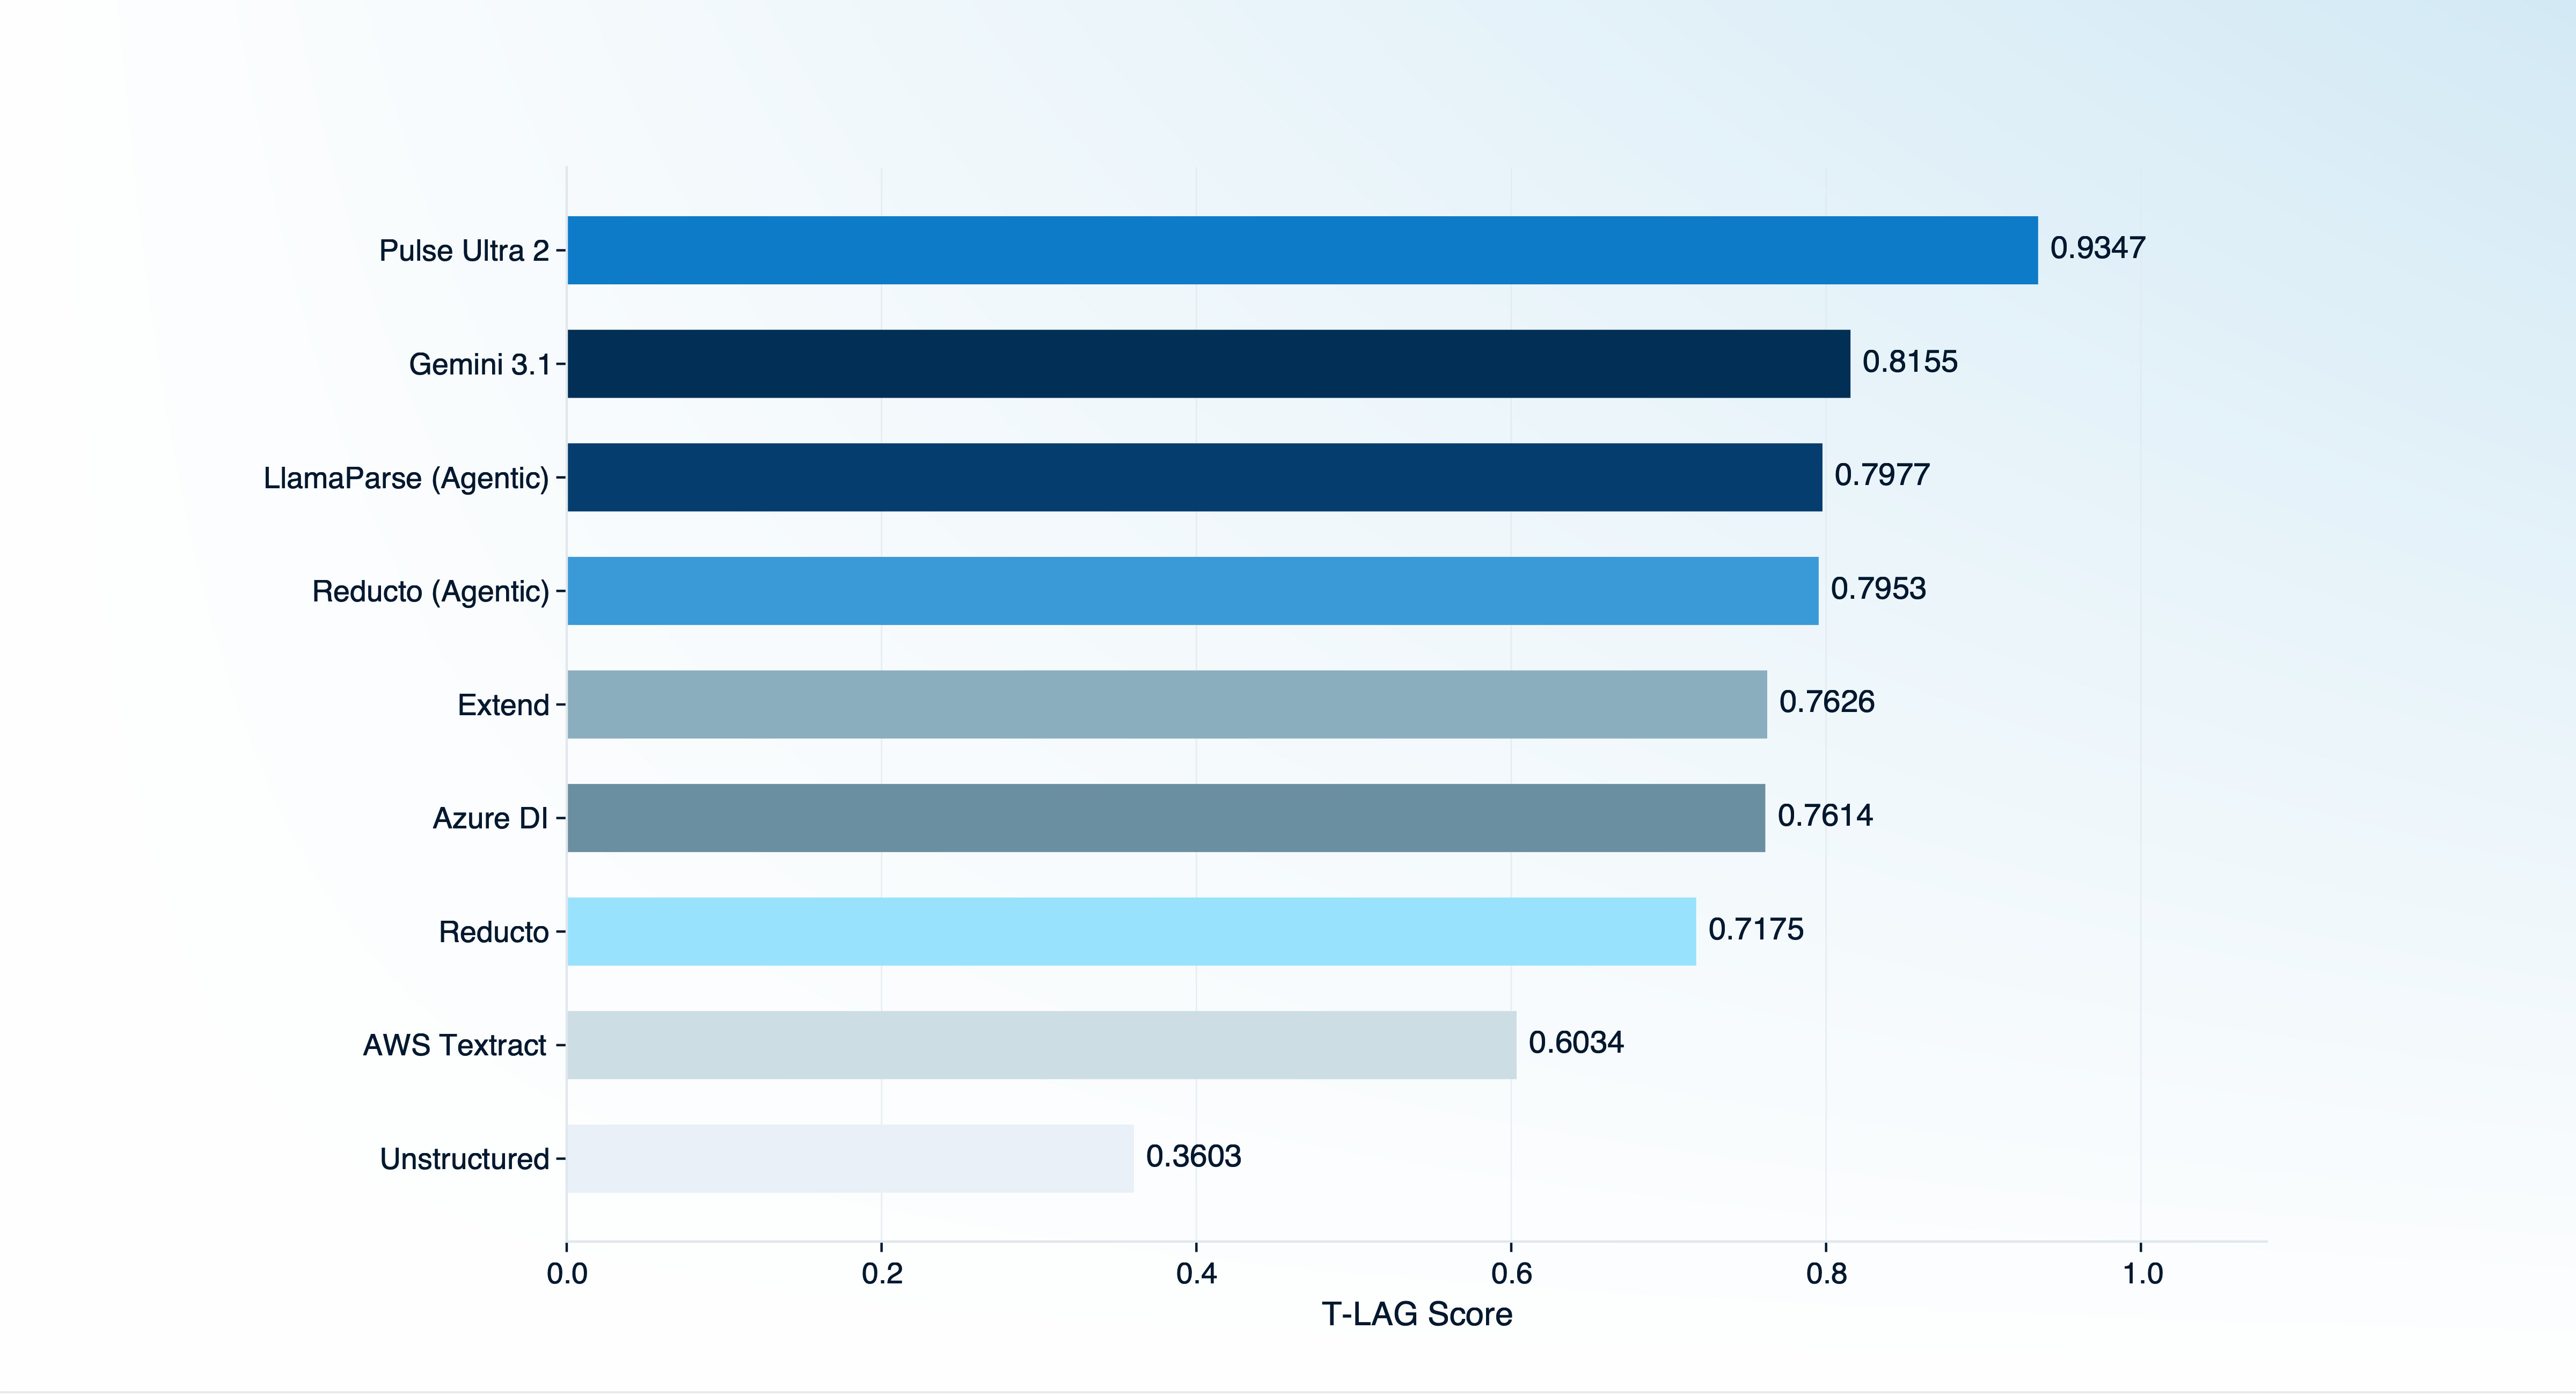
Providers were evaluated independently using publicly available APIs across all 1,820 samples. To avoid heavily penalizing providers for detection failures, only samples returned as tables were scored. Coverage (the percentage of samples each provider returned results for) is reported alongside accuracy.
Rank
Provider
T-LAG Score
Coverage
1
Pulse Ultra 2
0.9347
100.0%
2
Gemini 3.1
0.8155
99.5%
3
LlamaParse (Agentic)
0.7977
94.0%
4
Reducto (Agentic)
0.7953
78.8%
5
Extend
0.7626
91.9%
6
Azure Document Intelligence
0.7614
92.0%
7
Reducto
0.7175
80.4%
8
AWS Textract
0.6034
98.5%
9
Unstructured
0.3603
100.0%
Language
Pulse Ultra 2
Gemini 3.1
LlamaParse (Agentic)
Reducto (Agentic)
Extend
Azure Document Intelligence
Reducto
AWS Textract
Unstructured
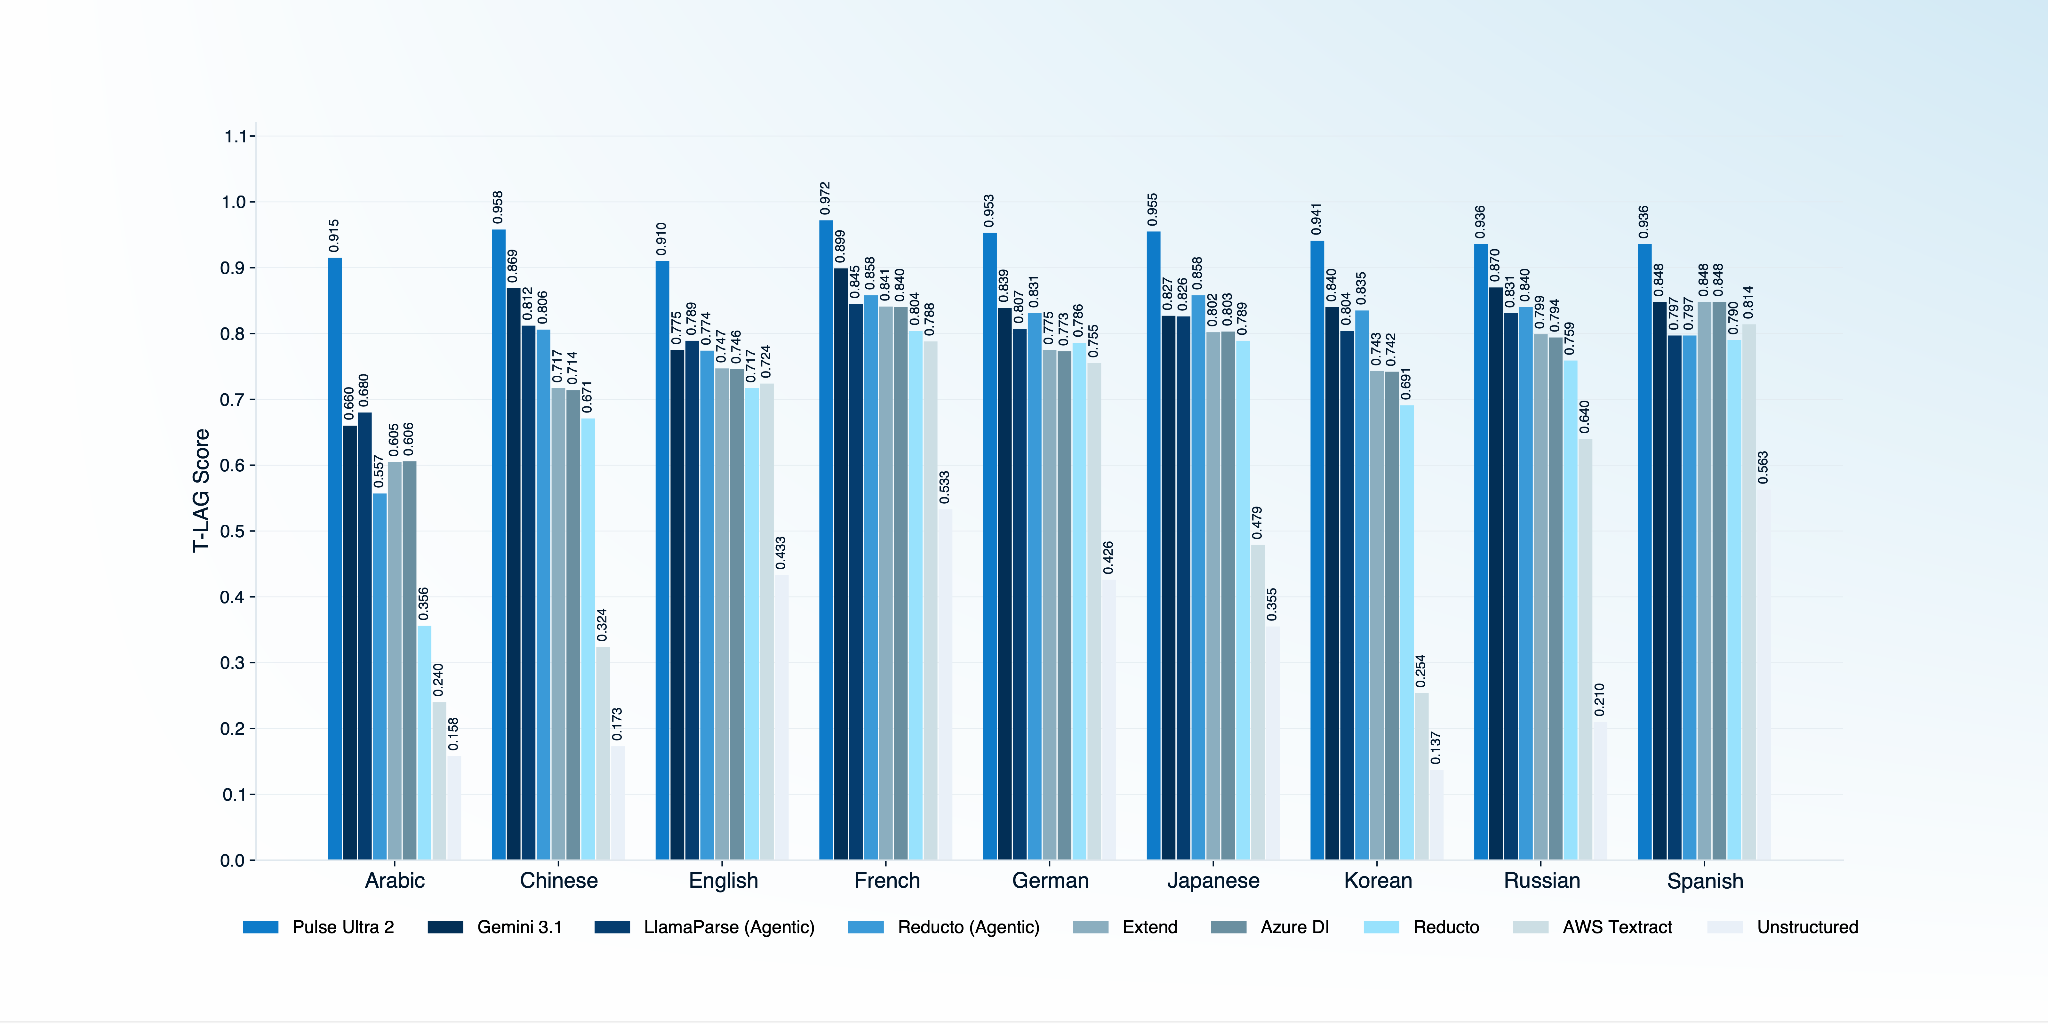
Arabic (146)
.915
.660
.680
.557
.605
.606
.356
.240
.158
Chinese (213)
.958
.869
.812
.806
.717
.714
.671
.324
.173
English (594)
.910
.775
.789
.774
.747
.746
.717
.724
.433
French (165)
.972
.899
.845
.858
.841
.840
.804
.788
.533
German (113)
.953
.839
.807
.831
.775
.773
.786
.755
.426
Japanese (159)
.955
.827
.826
.858
.802
.803
.789
.479
.355
Korean (84)
.941
.840
.804
.835
.743
.742
.691
.254
.137
Russian (170)
.936
.870
.831
.840
.799
.794
.759
.640
.210
Spanish (176)
.936
.848
.797
.797
.848
.848
.790
.814
.563
More graphs and granular scoring by table size, merged-cell impact, and score distributions are available in our research paper and benchmark viewer linked at the beginning.
Thank you to Dushyanth Sekhar and Mohammed Hadi of S&P Global's Enterprise Data Organization for their academic contributions to the benchmark methodology.¹
Thank you to the Pulse research team for designing and implementing the T-LAG metric, building the evaluation infrastructure, and running provider benchmarks end to end.
We are releasing the full dataset, scoring code, and research paper as open-source contributions. If you find PulseBench-Tab useful, have feedback, or want to submit your own model results, we would love to hear from you.
—
¹Pulse Software, Corp. (“Pulse”) acknowledges and confirms that nothing in the benchmark, its associated materials, or any public-facing content constitutes an endorsement of Pulse by S&P Global Inc., or any of their affiliates (collectively, “S&P”). Likewise, nothing constitutes an endorsement of S&P by Pulse.