


The Pulse team has spent the last two years building and breaking document extraction systems across hundreds of millions of pages. One thing is consistent across every benchmark we run: document extraction is not a single metric problem. It is a multi-dimensional, multi-modal engineering challenge where simple averages hide catastrophic failure modes.
We’ve written the following as a field guide for engineers who have lived through the grind of parsing messy PDFs, spreadsheets, scanned faxes, and multi-column tabular filings. The goal here is to lay out an introductory but still rigorous evaluation methodology - we have an exciting open-source benchmark building on this research coming out very soon.
Problem statement
Most public discussions of document AI rely on a single number. Usually it is accuracy or F1 on a small corpus of clean PDFs. That is comfortable for comparison, but it ignores four independent axes of failure that each make the extraction outputs unusable in downstream systems:
- Character recognition errors at the glyph level
- Layout interpretation errors including reading order and section boundaries
- Structure loss in tables, lists, outlines, and nested hierarchies
- Semantic corruption from model normalization, substitution, or hallucination
If any one of these fails, the entire document pipeline fails. A page can have perfect OCR but a broken reading order that renders text incoherent to any LLM in a retrieval system. A table can have correct wire detection but incorrect structure that destroys header to data relationships. A contract can have accurate paragraphs but with orphaned cross references that make it impossible to answer basic questions.
Methodology deep dive
Our evaluation framework scores models along orthogonal axes, with dataset slices and decision rules per axis. The intent is to measure not only average performance, but also variance under real operating conditions.
Pipeline at a glance

We evaluate the extraction models at multiple nodes in the pipeline. For example, we compute text similarity per region immediately after OCR and again after structure mapping to catch ordering or structure regressions.
Reading order is the silent failure mode
Reading order breaks whenever models process pages in raster order. Enterprise documents treat pages as physical constraints, not logical boundaries. The result is semantic fragmentation unless the pipeline reconstructs continuity explicitly.
We use a four stage reading order subsystem:
- Pre segmentation identifies blocks, figures, tables, headers, and footers. We learn a coarse taxonomy of block types to feed different downstream logic.
- Column graph construction converts spatial relations into a directed acyclic graph that encodes containment and adjacency. This step prevents naive left to right ordering from crossing columns and from mixing header footers with the main flow.
- Cross page linking carries context such as section titles, table headers, and figure references across page boundaries. We maintain state for open sections and open tables, similar to a streaming parser.
- Semantic stitching merges block sequences into paragraphs and sections, preserving hierarchy and reference links.
Diagram: reading order graph

Metric: Reading Order Accuracy
We evaluate reading order as a minimum edit distance over block sequences. Let \( \pi^* \) be the ground truth ordering of blocks and \( \hat{\pi} \) the predicted ordering. We compute:
\[
\text{ROAcc} = 1 - \frac{\text{EditDistance}(\hat{\pi}, \pi^*)}{\max(|\hat{\pi}|, |\pi^*|)}
\]
We also report Kendall tau rank correlation to capture pairwise inversions:
\[
\tau = \frac{\#\text{concordant} - \#\text{discordant}}{\binom{n}{2}}
\]
We slice ROAcc by layout pattern type: single column, two column, multi column with sidebars, and newspaper style with interstitial artifacts. We report separate scores for cross page continuity by computing the metric only on edges that cross page boundaries.
Example implementation:
We use long common subsequence distance because it penalizes inversions and dropped blocks without over penalizing local swaps that do not affect paragraph semantics.
Continuity checks
We run explicit tests for continuity failure modes:
- Header carry forward: verify that table headers detected on page k are associated with rows on pages k+1..k+m until a terminating header appears.
- Definition resolution: verify that references such as Section 2.1 link to the correct section token even across page boundaries.
- Footnote binding: check that superscript markers link to footnote bodies found later.
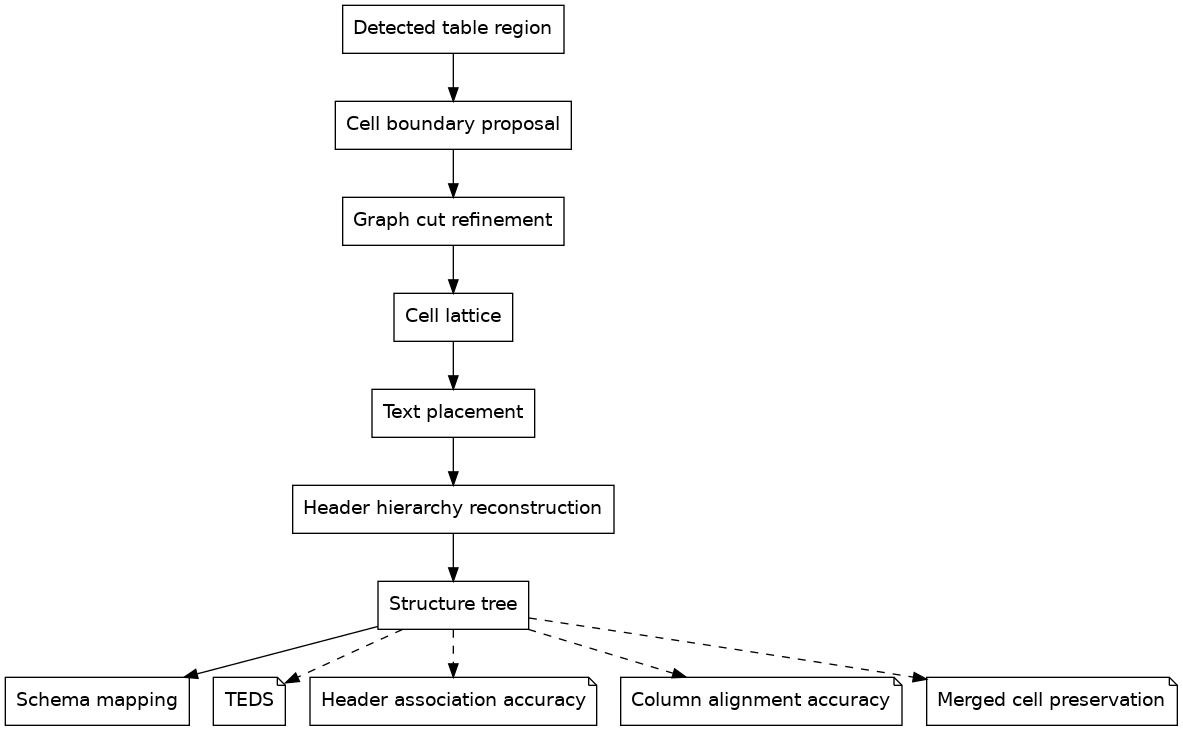
Table parsing is the hardest problem
Tables fail in ways that do not show up in simple text metrics like CER (character-error-rate) or WER (word-error-rate). Without structure, correct wire boundaries are useless. We treat table evaluation as a tree and as a set of alignment constraints.
Structure metric: TEDS
We compute TEDS between predicted and ground truth table trees. Trees are derived from HTML or Markdown with explicit row span and col span markers.
Alignment metrics
We add alignment tests that reflect how downstream systems use tables:
- Header to column association accuracy across multi row headers
- Column alignment accuracy for numeric vs textual columns
- Merged cell preservation rate for row span and col span recovery
- Row grouping consistency for hierarchical row headers
Pseudocode for header association:
Diagram: table parsing stages
Text and layout metrics
We compute ANLS at the region level rather than the page level. Regions are blocks produced by layout segmentation. This prevents high ANLS from masking incorrect ordering or boundary errors.
We also compute Section Boundary Detection F1 from labeled boundaries. Boundaries include headings, list starts, table starts, figure captions, and appendix markers.
Statistical rigor
We report uncertainty and significance explicitly. Each metric includes a 95 percent confidence interval computed with non parametric bootstrap over documents. For two systems A and B we report the bootstrap distribution of the paired metric delta and its percentile interval.
We also track variance per slice to surface brittleness. A model that wins on average but collapses on multi column scans is not production ready.
Performance and robustness
Latency and throughput matter because enterprise ingestion runs at scale. We measure average and tail latency per page at controlled concurrency levels and track error rates for corrupted or unsupported formats. We inject controlled noise into inputs such as resolution drop, JPEG artifacts, mild skew, and missing grid lines.
Results and insights
Our goal is to avoid marketing numbers here. Instead, we want to emphasize patterns that repeat across corpora and that inform engineering priorities.
- Reading order dominates perceived quality. Humans are tolerant of light OCR noise but will reject outputs that read out of order.
- Table structure brittleness is the top source of silent data corruption. Numeric columns that shift by one position will pass text similarity checks yet break analytics pipelines. Alignment and header association metrics catch this class of failure.
- Per region ANLS prevents layout errors from hiding under high page averages. The region view correlates with human review speed and reduces approval time in QA loops.
- Continuity checks cut error reports in long documents. Persisting table headers and section state across pages reduces both hallucinated headers and orphaned rows.
- Robustness curves are more actionable than single point scores. Noise sensitivity tests often reveal a steep drop at a realistic perturbation size. That becomes an engineering target for preprocessing or model fine tuning.
These observations drive where we spend model capacity and where we add deterministic guards such as header carry forward, column type checks, and numeric sanity constraints.
Future challenges
There is still a long list of open problems that require new evaluation methods as much as they require new models.
- Cross modal consistency across text, charts, stamps, and annotations. We need metrics and evaluation algorithms that align extracted text with chart traces and legend mappings.
- Evolving templates that change section order, table shapes, and boilerplate. Online continual evaluation with drift detection for layout distributions is an active research area for us.
- Ground truth creation at scale without label drift. We invest in the highest quality data labeling - with annotation policies, reviewer training, and automated audits that detect label style changes.
- Input and prompt integrity for extractors that include language models. We run canary checks for prompt-like strings embedded in PDFs and score refusal rates separately from accuracy.
Cost and complexity at scale. Evaluation needs to run continuously on production samples. That requires efficient instrumentation, careful sampling, and metrics that are cheap to compute without losing diagnostic value.
Practical guidance for teams
- Score along orthogonal axes. Text similarity, reading order, structure, continuity, and robustness.
- Slice by layout archetype. Single column, multi column, tables with and without lines, scans vs digital.
- Track uncertainty. Report confidence intervals and paired bootstrap deltas.
- Prefer per region metrics over per page. They correlate better with review effort.
- Promote continuity to a first class check. Treat cross page links as ground truth objects.
Evaluate under perturbation. Measure sensitivity to realistic noise and format changes.
Closing note
Evaluating document extraction is not about chasing a single leaderboard score. It is about proving that your system will keep working on the next million documents you have not seen yet. The only way to do that is to measure the things that actually break pipelines in the wild. Reading order and table structure are the twin pillars of that effort. Treat them as first class citizens in your evaluation, and your models will get better where it matters.
Our team is actively working on this research and will continue making improvements and adjustments here. If you have any ideas and find any discrepancies in our methodologies, please reach out - we’re happy to chat.
.svg)