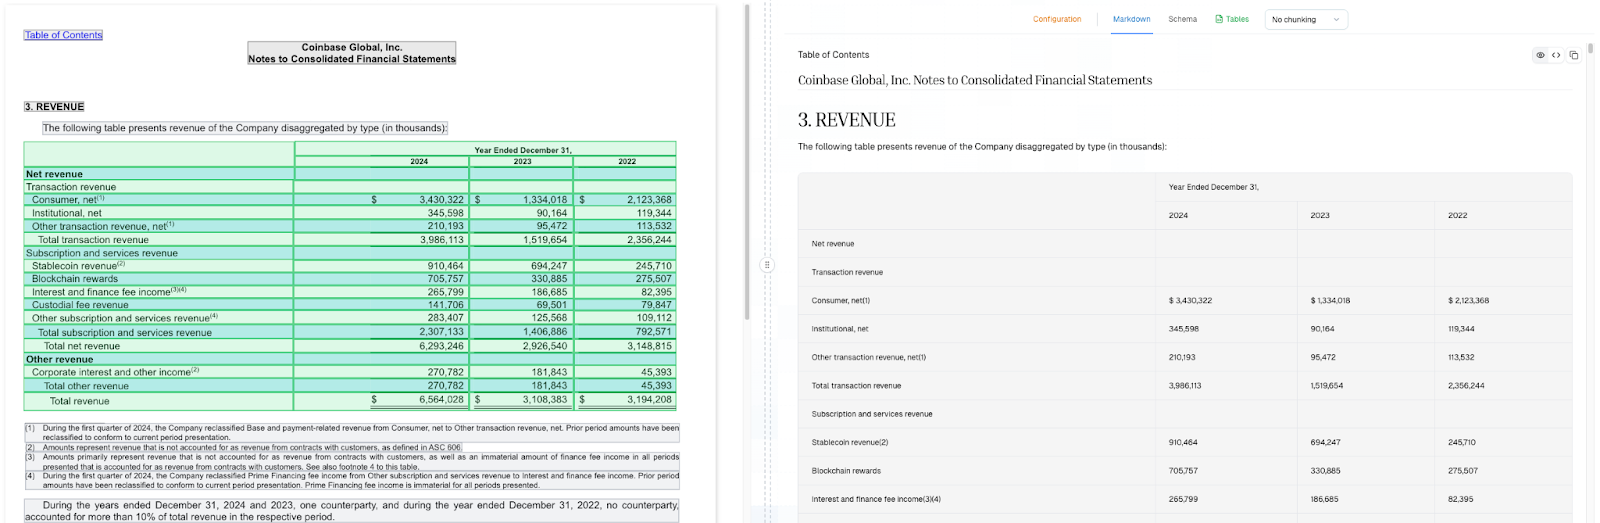
If you have ever tried to extract structured data from a 10-K filing or quarterly earnings report, you have likely discovered that "table extraction" is a misleading term. The tables in financial statements are not really tables in the simple rows-and-columns sense. They are hierarchical data structures encoded as visual layouts. That distinction is why most document processing systems fail to process them correctly.
The problem is not OCR accuracy. Modern OCR reads the numbers without issue. The problem is that financial statements encode meaning through structure. Flattening that structure into a simple grid destroys the information you actually need.
The Hidden Hierarchy in GAAP/IFRS Formatting
Financial statements follow standardized accounting conventions that create nested hierarchies. These are not arbitrary design choices. They encode the logical relationships between line items that drive roll-up calculations and validation.
Consider an income statement. It does not simply list expenses in a flat sequence. It nests them by function:
- Operating Expenses contains SG&A.
- SG&A contains Marketing.
- Marketing might break down further by region or campaign type.
The indentation is not decorative. It indicates that Marketing is a child of SG&A, which is a child of Operating Expenses. These parent-child relationships determine how totals must reconcile.
Balance sheets create similar structures. "Current Assets" is not just a header; it is a container. Its value must equal the sum of Cash, Accounts Receivable, Inventory, and any other items nested beneath it. When an extraction system loses this hierarchy, it cannot validate whether the numbers add up. You get data, but you lose the constraints that make that data meaningful.
The Three-Dimensional Problem
The complexity compounds when you add multi-period comparatives. A typical quarterly filing shows Q1, Q2, and Q3 side by side. Each column represents the same hierarchical structure at different points in time. You now have three dimensions:
- The Time Axis (across columns)
- The Line Item Axis (down rows)
- The Hierarchy Depth (encoded through indentation and grouping)
Most extraction systems model tables as two-dimensional grids. They handle rows and columns effectively. However, when they encounter this third dimension, they must flatten it somewhere. This causes information loss. Either the hierarchy collapses into meaningless flat lists, or the temporal relationships blur.
This is why you cannot run a generic table extractor on financial statements and expect usable output. The 2D grid assumption is baked into most architectures, and financial statements violate that assumption by design.
The Footnote Problem
Then there are the footnotes. Financial statements are filled with superscript references like "Revenue (1)" or "Net Income *". These are not separate values. They are metadata attached to the primary number that point to explanatory notes elsewhere in the document.
Naive cell boundary detection often treats "(1)" as its own cell or, worse, as part of the numeric value. Either way, the data is corrupted. The footnote reference needs to travel with its parent number as metadata rather than getting parsed as a separate data point.
This may sound like a minor annoyance, but it compounds at scale. A single quarterly report might have dozens of footnote references. Mishandling them does not just create noise; it breaks the link between numbers and their qualifications. This matters enormously for anyone performing actual analysis on the extracted data.
Why Better OCR Is Not the Answer
When extraction fails on financial statements, the instinct is to improve OCR accuracy. Yet the OCR is usually not the bottleneck. The characters on the page are being read correctly. The problem is what happens after that point.
The real fix is modeling the accounting structure itself. This requires an understanding of several key factors:
- Indentation encodes hierarchy.
- Summary rows are summations of their children.
- Footnote markers are metadata, not values.
- Multi-period layouts create implicit relationships across columns.
At Pulse, we preserve hierarchy in our output. Rather than flattening data to a simple grid, we emit nested JSON with explicit parent pointers. This means downstream systems can query "all items under Operating Expenses" directly instead of trying to reconstruct that relationship from visual proximity.
It also means validation becomes possible. When you preserve the constraint that Current Assets should equal the sum of its children, you can check whether extracted values satisfy that constraint. Discrepancies become visible, which is far superior to silent data corruption.
The Practical Implications
For teams building financial data pipelines, the implications are significant. If you use a general-purpose table extraction tool, you are almost certainly losing structural information that matters for downstream analysis. The output might look complete, but it is semantically impoverished.
The questions to ask any extraction system are simple:
- Does it preserve hierarchy?
- Can it distinguish summary rows from detail rows?
- Does it keep footnote references attached to their parent values?
- Can it handle multi-period layouts without collapsing the temporal dimension?
These are not edge cases. They are the core structure of every GAAP/IFRS financial statement. Getting them right is the difference between extracted data you can actually use and extracted data you have to manually reconcile.
Building document pipelines for financial data? Chat with our team here.