Table extraction is one of the hardest unsolved problems in enterprise document intelligence. Tables encode structured relationships where position is meaning, and a number landing in the wrong cell doesn't just look wrong. It breaks downstream analytics, compliance workflows, and financial models. The cost of a silent extraction error (a column swap, a missing header, a misaligned merge) is categorically different from a text OCR mistake.
At Pulse, we've spent the past years training table extraction models across 100+ languages, handling merged cells, RTL scripts, borderless tables, and multi-level headers. As the space matures, benchmarks matter. They're how the industry measures progress and how customers compare providers. We wanted to take a close look at the existing benchmarks to understand what they measure, where they excel, and where there are gaps that the community should address together.
Benchmark Deep Dives
OmniDocBench (OpenDataLab)
What they got right. OmniDocBench evaluates tables alongside text, formulas, and layout detection. The attribute-level granularity is genuinely useful: six structural tags covering frame type, merged cells, formulas in cells, colored backgrounds, and rotated tables enable diagnostic breakdowns. The benchmark consists of 1,355 pages with over 20,000 block annotations and dual-format ground truth in both LaTeX and HTML, which allows for a detailed evaluation.
Where the evaluation falls short. The core metric, TEDS, conflates formatting with structure. The same 3×3 table with identical cell contents and positions will score differently depending on whether the HTML uses <thead>, <tbody>, or <th> wrappers. Consider a simple revenue table with quarters as columns: one valid HTML encoding wraps the header row in <thead> with <th> elements while another uses plain <tr> and <td> throughout. These represent the same table, but TEDS penalizes the difference because the DOM trees diverge. TEDS also computes tree edit distance symmetrically, with no directional awareness. A column transposition (columns A and B swapped) and a content error (wrong text in the correct position) can produce similar edit costs, but these are fundamentally different failures with different downstream consequences.
The benchmark includes English and Chinese plus a small "mixed" category, but two languages isn't multilingual and won’t represent enterprise requirements at scale. In our experience, Arabic scripts usually reduce the extraction quality by over 10 points on average.
SCORE-Bench (Unstructured)
What they got right. SCORE-Bench correctly identifies what is arguably the core problem in table evaluation: semantically equivalent tables with structurally different HTML get unfairly penalized by traditional metrics. The metric design separates content accuracy from index accuracy, meaning a system that reads cells perfectly but shifts a column registers a different failure mode than one that positions cells correctly but misreads text.
Where the evaluation falls short. The spatial tolerance parameter is introduces a shift allowance (δ) that lets predicted cells match ground truth cells offset by up to δ positions. In theory this forgives minor structural ambiguity. In practice it can hide serious failures. Consider a financial table where the header row ("Region / Q1 / Q2") is missing from the prediction and all data rows shift up by one. With δ=1, every data cell aligns to its neighbor and the benchmark reports high content accuracy - but the column headers are gone entirely. In production, losing the headers from a financial table means the numbers are meaningless. A system that handles simple 3×3 grids perfectly but fails on 20-row tables with multi-level merged headers looks identical to one with the opposite profile.
ParseBench (LlamaIndex)
What they got right. ParseBench broadens document parsing evaluation beyond tables alone, covering charts, content faithfulness, semantic formatting, and visual grounding as distinct dimensions. The emphasis on semantic correctness and the formatting dimension (strikethrough, superscripts, bold) highlight genuinely underexplored failure modes. The benchmark and evaluation code are publicly available, which is important for reproducibility.
Where the evaluation falls short. The ground truth is generated by frontier VLMs (Claude Opus for tables, Gemini Flash for charts, Gemini 3.0 Flash for content), which always introduces potential hallucinations and biased ground truths . But for tables, the paper acknowledges that "HTML structure is too complex for annotators to manually edit reliably," so annotators flag issues in natural language and a second LLM applies corrections. The table metric, TableRecordMatch, treats tables as unordered bags of key-value records and by design does not penalize column transposition or row reordering. The table dataset is also small (503 pages) with 54.5% from a single source (SERFF insurance filings), and the entire benchmark is English-only with no multilingual coverage whatsoever.
RD-TableBench (Reducto)
What they got right. RD-TableBench is publicly available, which is the single most important thing a benchmark can be. The 1,000 table images, ground truth HTML, and provider outputs for all evaluated systems are all downloadable and inspectable. The dataset also includes a reasonable variety of table structures and visual complexities, which aids in the real-world evaluation.
Where the evaluation falls short. The scoring methodology linearizes the 2D table into a 1D sequence before running Needleman-Wunsch alignment. Tables are two-dimensional structures where horizontal adjacency (cells in the same row) and vertical adjacency (cells in the same column) carry different semantic meaning. A table with two columns swapped could align well under 1D sequence matching despite being structurally wrong; the values might match up with nearby cells, but they're in the wrong column.
The dataset includes 15 languages, with English as the largest subset (461 of 1,000 samples). However, there is no Arabic or other RTL scripts, and most non-English languages have fewer than 100 samples, which limits the statistical reliability of per-language breakdowns.
Ground truth quality. We audited all 1,000 ground truth files by comparing each one against its source image, with manual verification. We identified 43 ground truth files (4.3% of the dataset) with verifiable errors that do not accurately represent the tabular structure + content being evaluated. This suggests that the ground truth HTMLs were generated with a system or using a baseline provider output without full proper human review.
The errors span three categories:
Category 1: Scrambled words which match exactly with Reducto provider outputs
Example : 4214_png.rf.63011f1174e6102dd9fe3055e43b3fed
Image reads 'Arid tropical scrub forest', but both ground truth and Reducto have 'tropical forest Arid scrub', this continues for other columns.

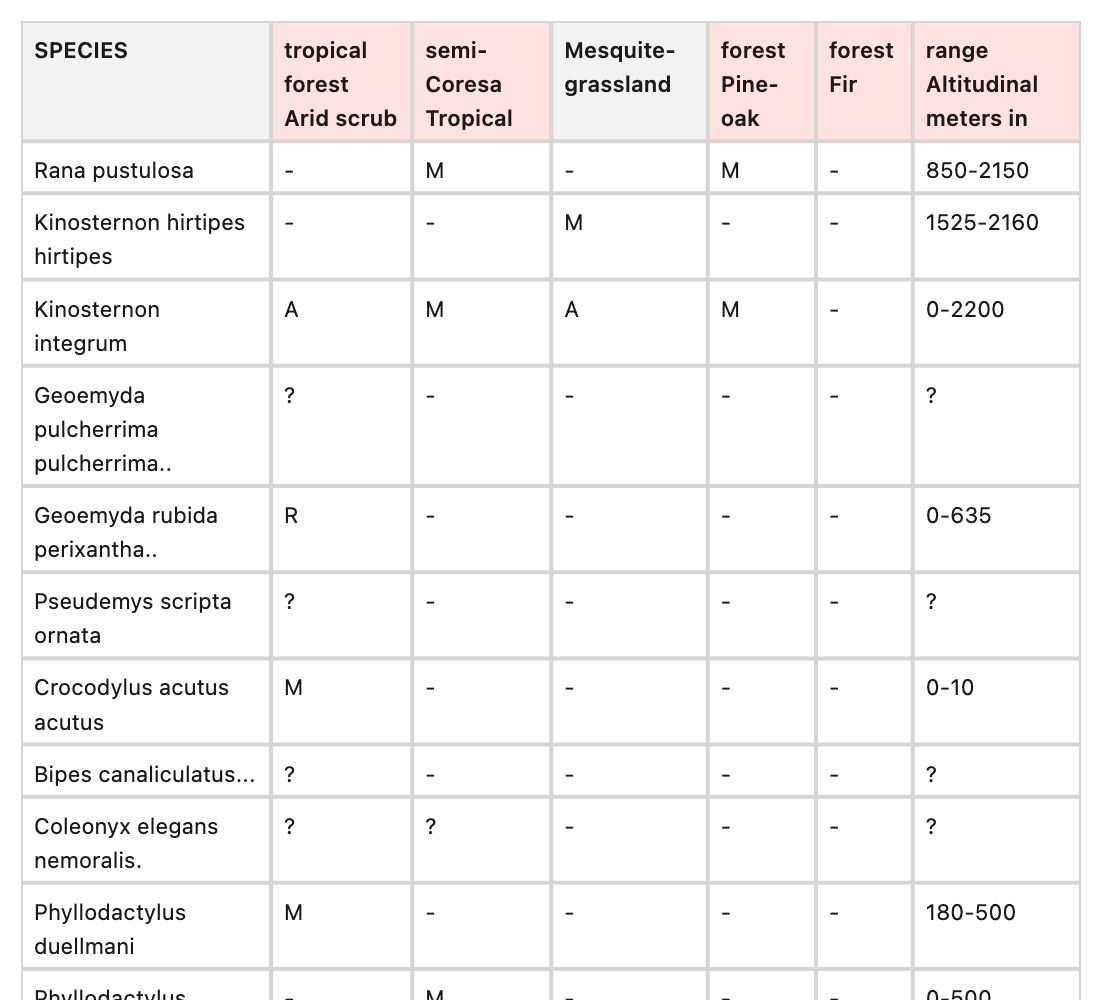
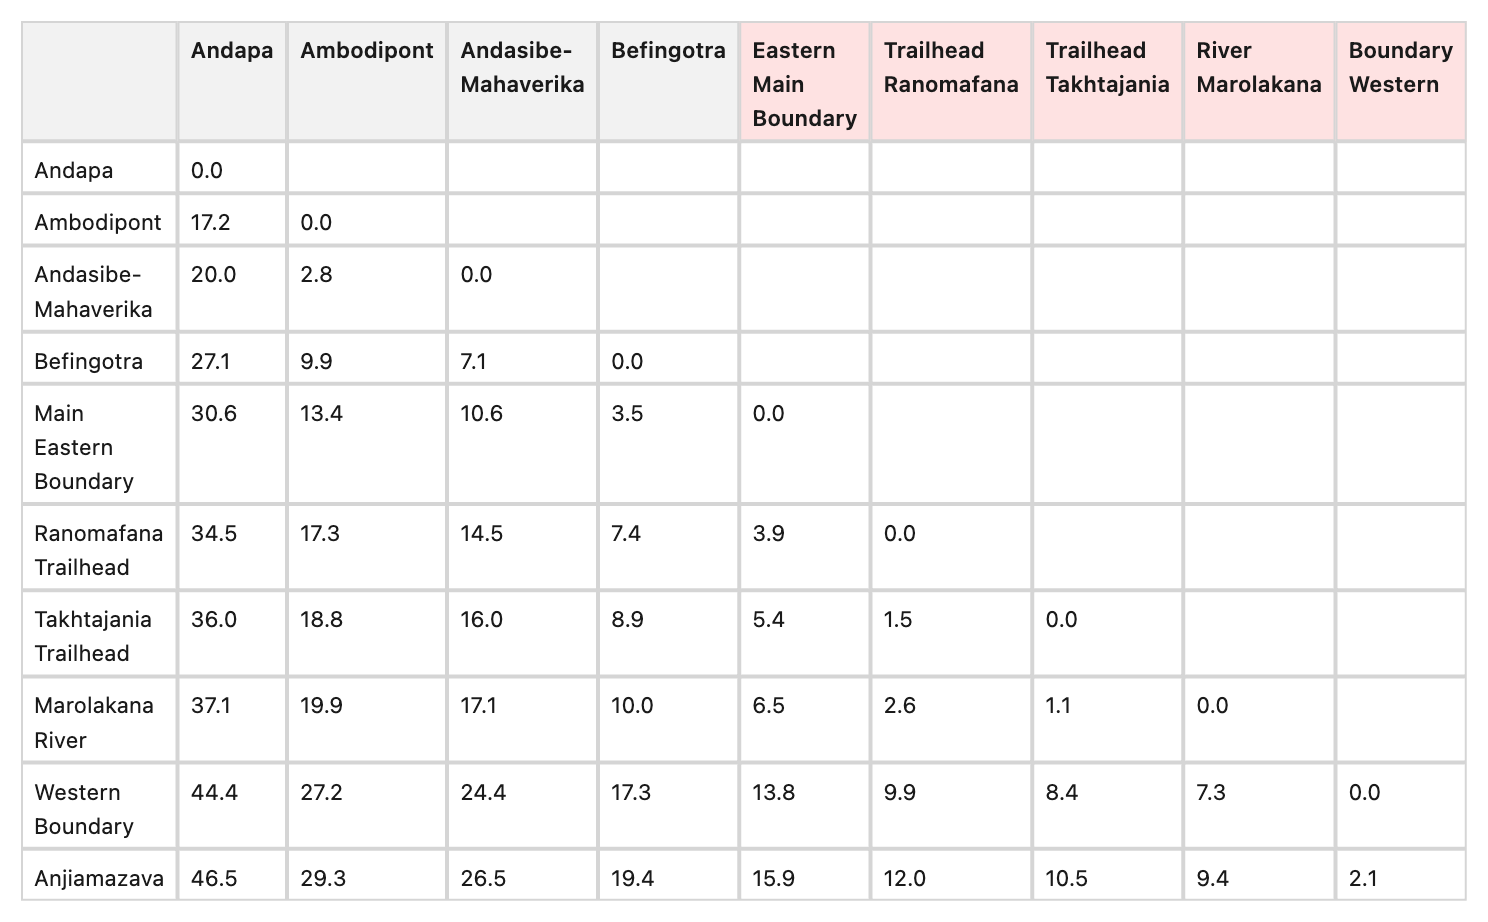
Example : 6442_png.rf.c0b694c9cbc4fd262c4a58301978f692
The headers for columns 7-10 clearly read 'Ranomafana Trailhead', 'Takhtajania Trailhead', 'Marolakana River', and 'Western Boundary' (which perfectly matches the row headers). However, both GT and Reducto reverse these words, outputting 'Trailhead Ranomafana', 'Trailhead Takhtajania', 'River Marolakana', and 'Boundary Western'
Category 2: random digit sequences appended or prepended to real numeric data values
Example : 1174_png.rf.6f823c357bfdd1b13ae2635d65f257a1
Multiple cells with buffer artifacts and completely incorrect cell values as a result: '7,9' has appended '10629473', '22,6' has appended '148485651', '1.5' has prepended '3422142', '6,3' has appended '07436', '7,4' has prepended '7911'

Category 3: Garbled OCR - OCR transcription errors that do not match the image, including hallucinated characters from borders, severe mangling of repeated text, and added punctuation.
Example: 17859_png.rf.7335d53a220899f49eb8fffd33d84356
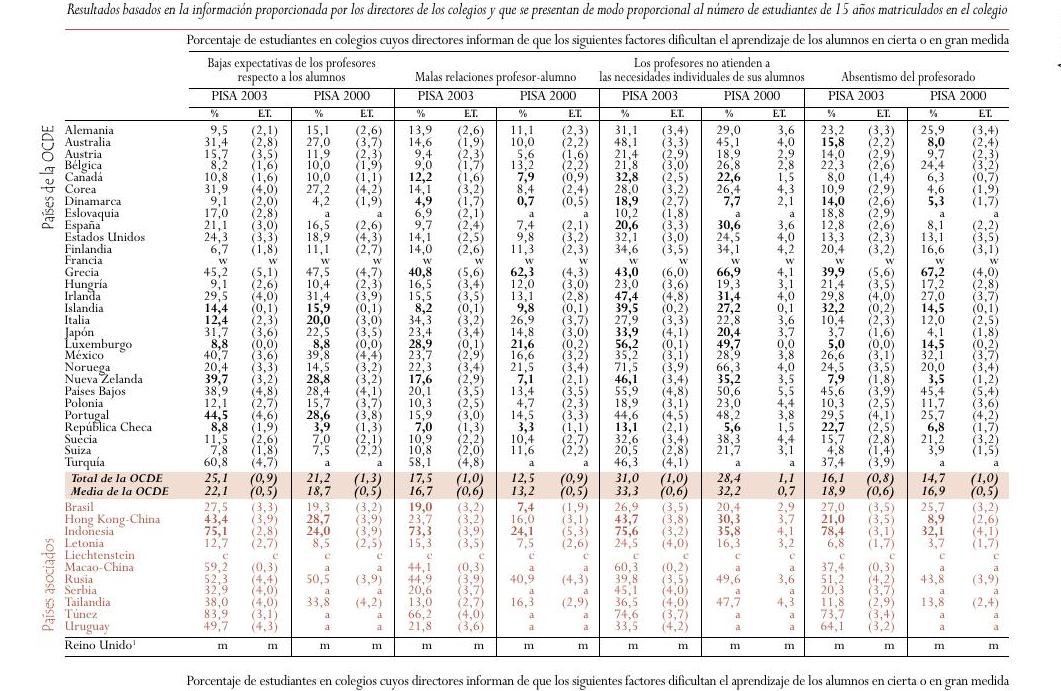
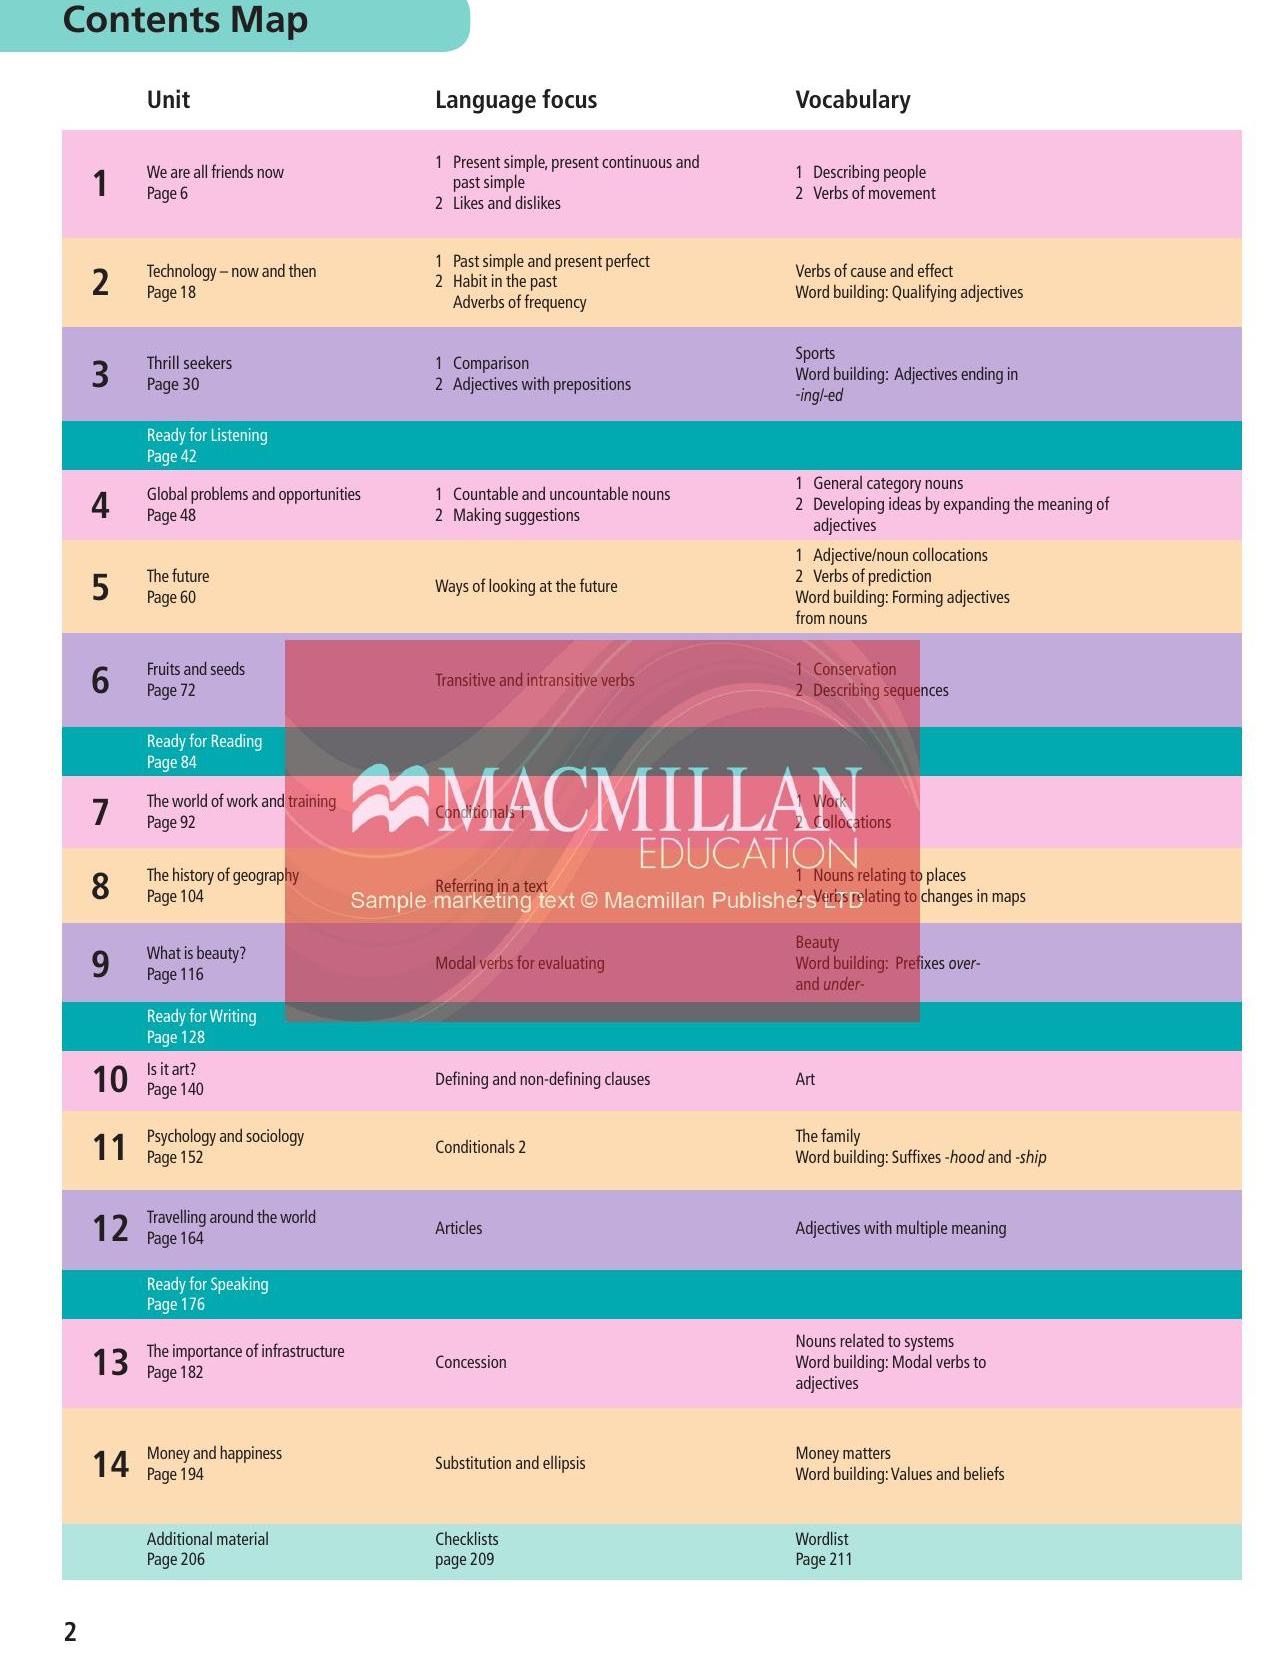
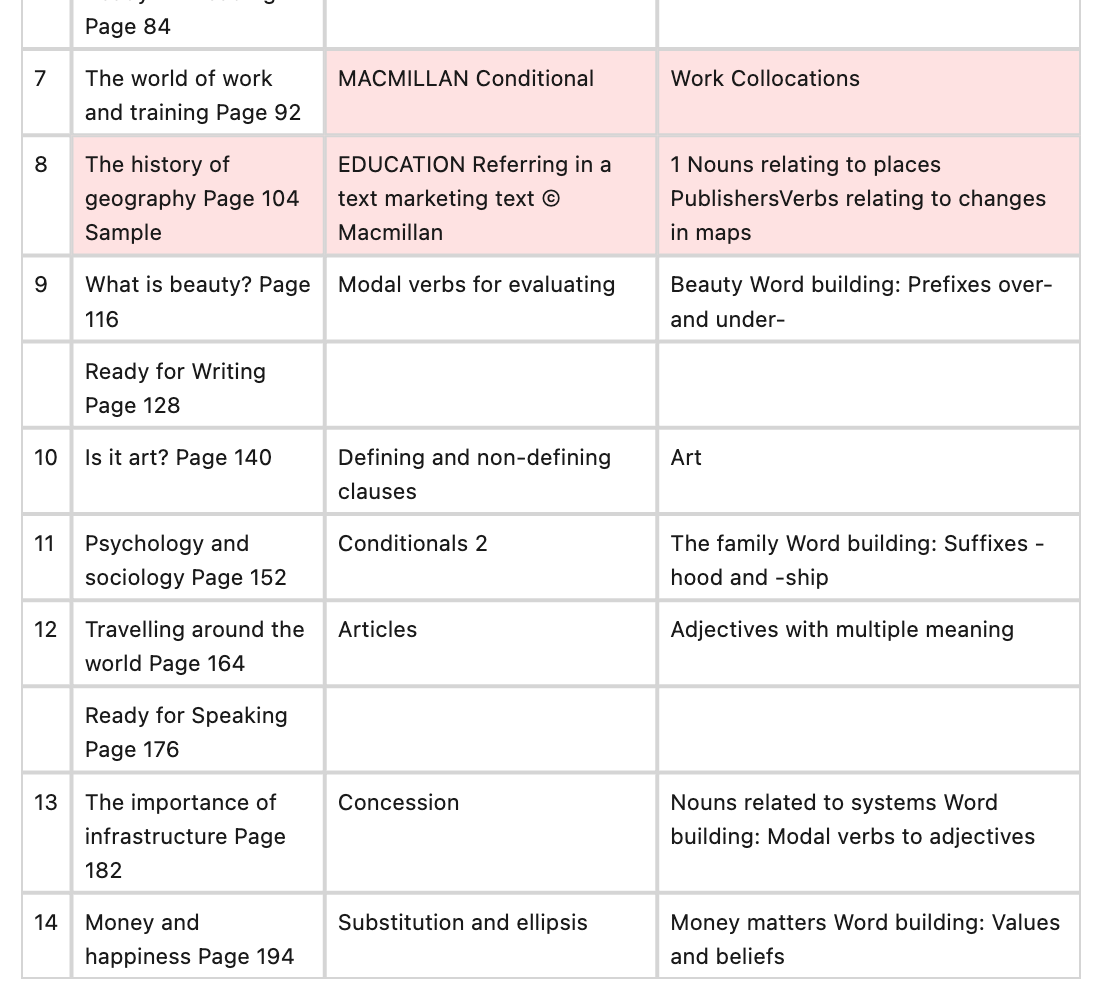
Watermark text bleeding into ground truth text. GT has 'EDUCATION Referring in a text marketing text © Macmillan'. Row 8 Vocabulary: GT merges watermark text with actual text to produce 'PublishersVerbs'.
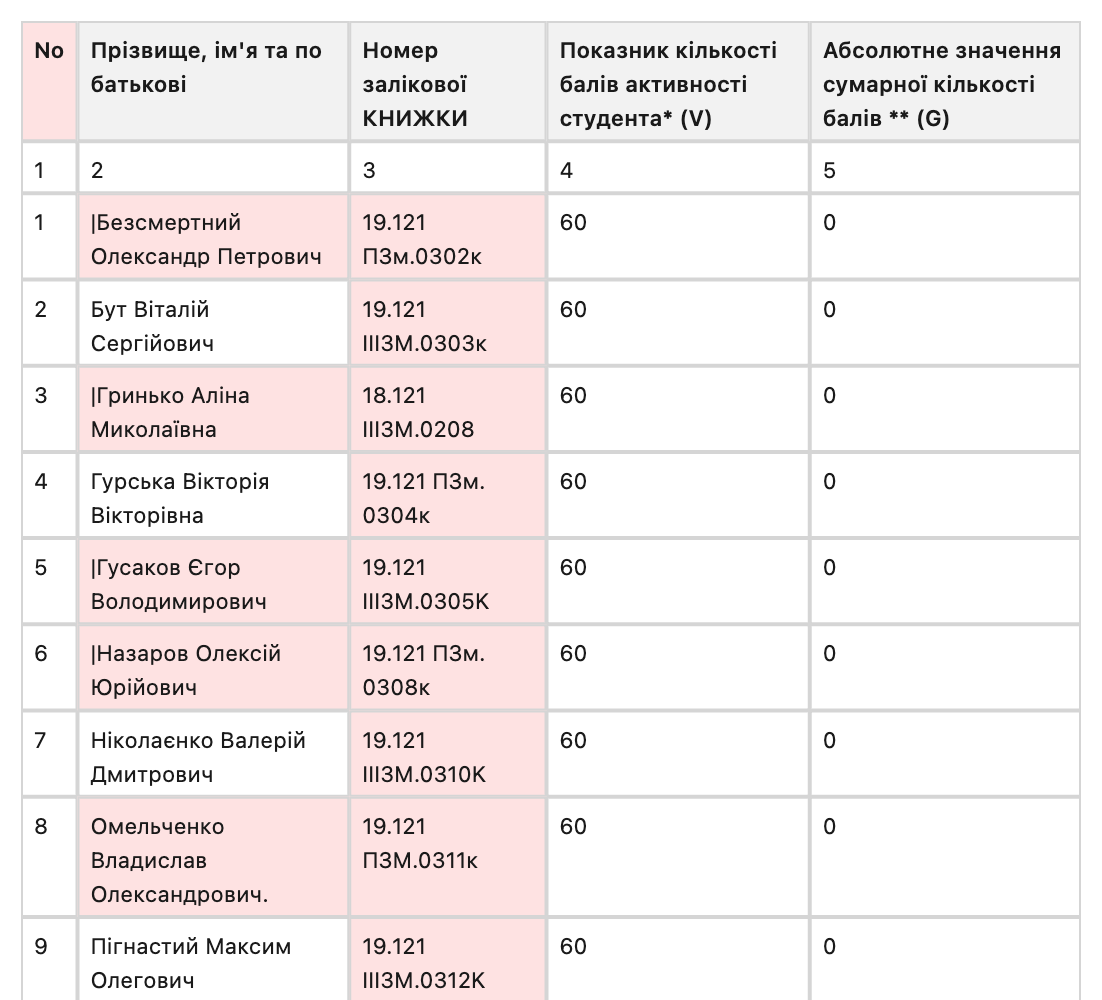
Example: 14225_png.rf.0828f6ed5ee40f1b58bee73c51288503
GT incorrectly includes a pipe '|' at the start of names in Column 2 for rows 1, 3, 5, 6, 10, 13, 14, and 15. In Column 3, GT consistently fails to read the prefix 'ІПЗм' correctly, either severely misreading it as 'III3M'

GT-provider similarity. As part of the audit, we compared the ground truth against all provider outputs shipped in the RD-TableBench HuggingFace dataset. One finding stood out: 89 of the 1,000 ground truth files are byte-for-byte identical to Reducto's output.
Shared errors. In 15 of the 43 verified GT errors, the ground truth and Reducto's output contain the same specific error while independent providers do not. For example, column headers appear in the same incorrect word order in both GT and Reducto ("tropical forest Arid scrub" instead of "Arid tropical scrub forest"), both incorporate watermark text ("MACMILLAN") into table cell content, and both produce identical garbled character sequences for CJK text. In each case, at least one independent provider produces correct or different output for the same sample.
Scoring impact. We produced corrected GT HTML for all 43 flagged samples and re-scored all outputs using the same Needleman-Wunsch methodology. The full benchmark average is unchanged after correction. On individual shared-error samples, the score drops are larger: -14.0% on sample 28612, -12.5% on sample 29887, and -6.6% on sample 594.
We raise this in the interest of transparency and because we believe it is important for the community to be able to evaluate benchmark integrity alongside benchmark results.
What We Think the Field Needs
Based on what we've seen across these benchmarks, a few principles stand out.
Multilingual by design. RTL scripts, CJK, and Cyrillic need to be in the core dataset. Performance on English-only tables does not predict production performance across languages.
2D-aware evaluation. Metrics should preserve directional relationships rather than flattening tables into sequences or trees. Horizontal adjacency and vertical adjacency carry different semantic meaning, and the metric should reflect that.
Structure and formatting cleanly separated. HTML convention differences - <th> versus <td>, presence of <thead> - should never be penalized as structural errors.
Everything open. The dataset, the ground truth, the scoring code, and the per-sample results. If a benchmark can't be independently verified, its rankings can't be trusted regardless of who publishes it.
Diagnostic depth over aggregate scores. Breakdowns by language, table complexity, merged cell presence, and border style give practitioners actionable information that a single number never can.
This is what motivated us to build PulseBench-Tab. We’d love to have the community pitch in on how our research team can improve: the goal is to push the frontier of our industry.