


The documents that matter most inside upstream operations are not the ones modern document AI was built for. The training distribution that produced today's general-purpose extraction tools is overwhelmingly text-first: filings, contracts, articles, web pages, and the kind of structured forms that show up in consumer workflows. That distribution maps poorly to what upstream operators actually run on. The documents at the center of high-stakes decisions in exploration and production are engineered artifacts rather than written ones. They carry their meaning in spatial relationships, in coordinate alignment, in domain-specific conventions, and in the relationship between symbolic content and the geometry that organizes it. They are read along axes that are not left-to-right and top-to-bottom. They were never meant to be parsed in reading order, because they were never meant to be read in reading order.
The operating rhythm of an upstream operator is anchored in documents of this kind. A reservoir engineer reading a composite well log is not reading text. They are reading depth-indexed time series across multiple overlaid tracks, each with its own vertical scale, each calibrated against a depth column that is the document's organizing axis. A drilling engineer reading a well schematic is not reading a description of a well. They are reading a cross-section of an engineered structure where every dimension only means anything in relation to the depth column on the side of the page and the casing geometry on the other. A geoscientist annotating a 1985 scanned wellbore record is interpreting a document where the most important information often sits in the margins, in handwriting, at angles. None of these are extraction problems in the way a contract or an invoice is an extraction problem. They are interpretation problems, where structure is the content and the parser's job is to recover structure first and content second.
Consider the kind of document a drilling engineer evaluates when planning a well. The schematic that documents an existing or proposed well includes a stratigraphic column on one side listing every geological formation the well passes through, with depth markers in meters running vertically down the page. Adjacent to that column is a dual-axis plot showing formation pressure coefficient as one curve and drilling fluid density as another, both expressed as functions of depth. The right side of the page is the engineered structure itself: a series of nested casing strings stepping down in diameter as the well deepens, with the diameter and the depth of each casing string labeled along the structure. A single page of this kind can contain fourteen named formations, two simultaneous engineering curves, seven casing strings, seven matched drill bit specifications, and text in three orientations. The information density is high, but the difficulty for a parser is not density. The difficulty is that none of the numerical values on the page mean anything in isolation. A drilling fluid density of 1.40 to 1.65 grams per cubic centimeter is operationally meaningful only when it is associated with the correct depth interval and the correct geological formation. A casing diameter of 193.68 millimeters is meaningful only when it is associated with the depth at which that casing was set. The page is not a list of facts. It is a coordinate system, and the facts only exist as positions within it.

This is what makes engineered documents structurally different from written ones, and it is also what makes them the hardest class of documents to extract reliably. A sequence-based parser reading the page in textual order has no mechanism for recognizing that 1.40-1.65 belongs to Member II of the Shaximiao formation and not to the formation directly above or below it, because the association is spatial rather than syntactic. The numerical value sits next to the depth-indexed envelope, the envelope spans a specific depth interval, and the interval corresponds to a named formation in the stratigraphic column on the left. Three orthogonal pieces of geometry have to be reconciled before any single number on the page becomes operationally useful. A parser that treats the page as a sequence of tokens, however large its context window, is solving the wrong problem.
The right output for a document of this kind is not a transcription. It is a table where every row represents a depth interval and every column represents an engineering value that holds within that interval. From the page described above, the right output is fifteen rows: one for the Lower Cretaceous Jianmenguan formation from zero to 379 meters, one for the Upper Jurassic Penglaizhen formation from 379 to 1,574 meters, and so on down to the Silurian at the well's total depth of 7,793 meters. Each row carries a formation pressure coefficient and a drilling fluid density, and where the drilling method was air rather than mud, the drilling fluid density column carries the value "Air drilling" rather than a numerical entry. The depth boundaries are continuous from row to row, because the parser has correctly inferred that each formation's depth-to value is the same as the next formation's depth-from value. This is not a transcription of the page. It is the queryable representation of what the page actually means.

Producing that output reliably is what document intelligence for upstream operations has to look like. The parser has to recognize that a hatched fill pattern conveys semantic information rather than decoration, that paired range values like 2.14-2.25 belong to a specific depth interval and not to the depth interval above or below it, that domain-specific vocabulary like "Air drilling" is a meaningful value rather than a parsing artifact, that text rotated ninety degrees is still text and still has to be associated with the correct row. The parser also has to recognize that a single page can contain two distinct semantic regions that should resolve into separate outputs rather than a single merged table, and that the location of every value on the source page is itself meaningful, so any number in the output can be traced back to where it appeared in the original document. None of these are surface-level extraction problems. They are problems of structural understanding, and the difference between a system that can solve them and a system that cannot is the difference between a useful output and an output that has to be hand-corrected by an engineer before it can be used downstream.
The same argument runs through other classes of upstream document, in different geometries. A chrono-stratigraphic chart of the kind a basin geologist uses to correlate seismic surveys with regional stratigraphy is organized around geological time rather than depth, and the structure of the page changes accordingly. Instead of one column on the left and one engineered cross-section on the right, the chart runs eleven parallel columns down the page, each carrying a different reference framework: epoch, stage, foraminifera zone, calcareous nanno-plankton zone, Sarawak cycles, palynozones, seismic markers, tectonic events. Every column is calibrated against the same age axis in millions of years, and the geological meaning of any one entry depends on its horizontal correlation with the entries in the other ten columns at the same age. A reservoir geologist reading the chart is not reading a list. They are reading a multi-framework correlation in which the meaning of "the Andaman Sea Breakup at 11.3 Ma" is constructed from a horizontal slice across the entire page. The parser's job, again, is to recover that structure first and content second.
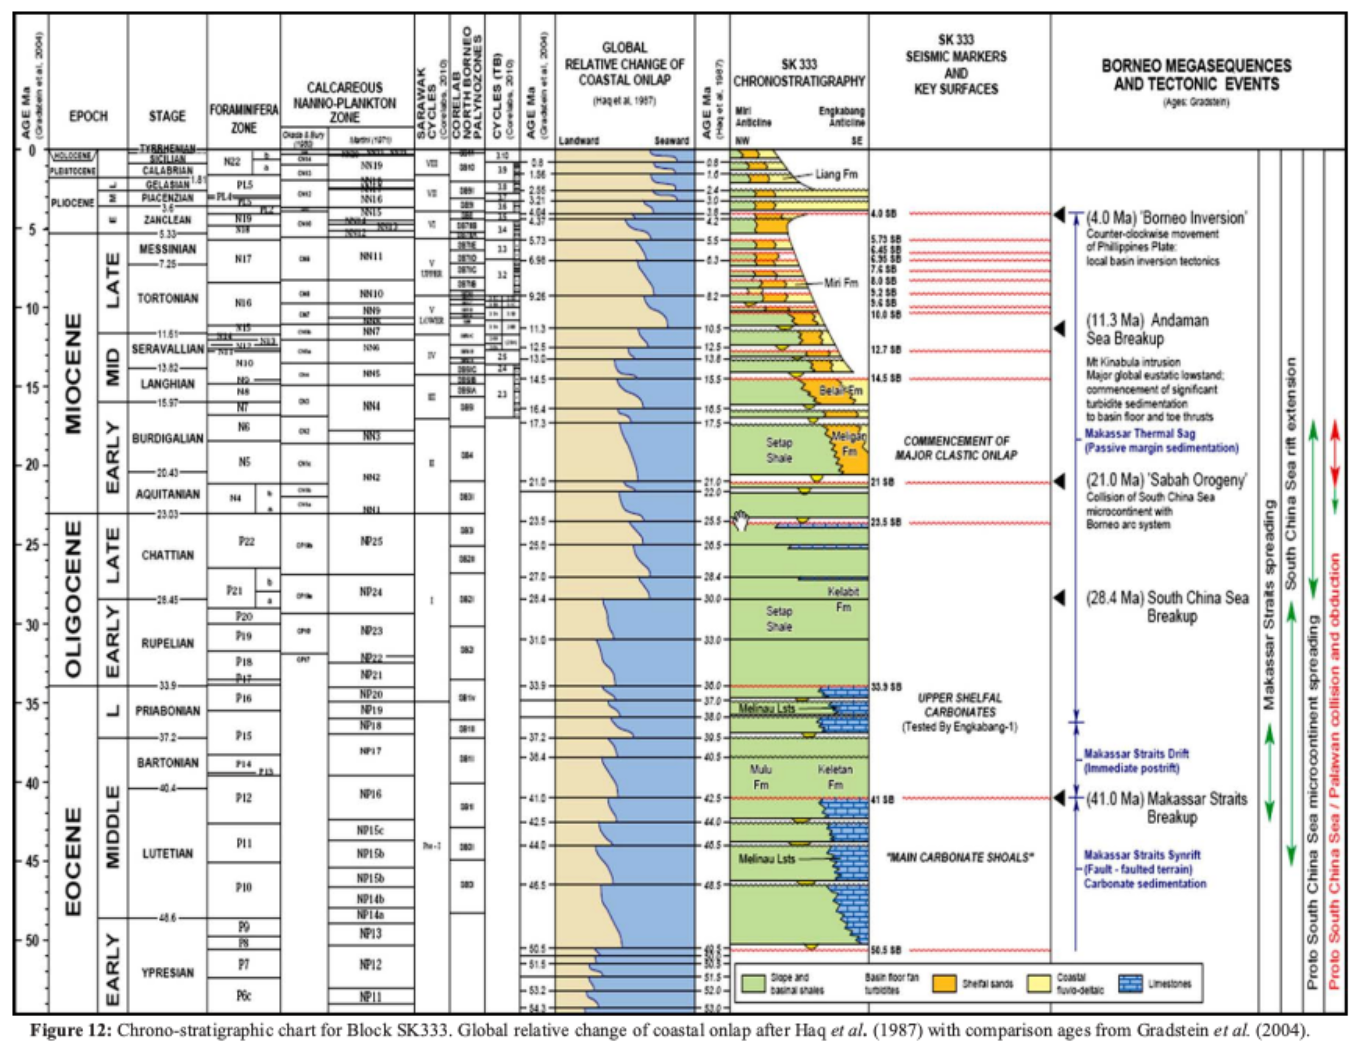

Pulse was built for this class of document. The well schematic and the chrono-stratigraphic chart are two examples among many. The shape of the work is consistent across all of them: the documents that upstream operators run on are engineered artifacts, the meaning is in the structure, and the parser has to read the structure first. Everything downstream depends on getting that right.

