Most discussion of table extraction in oil and gas concentrates on documents that report quantities: production volumes, allocation statements, cost detail on a field ticket. Those are hard for well understood reasons. There is a second family of documents that is harder and gets far less attention, and it is the family that sits closest to the capital allocation decision. A basin screening matrix, an acreage evaluation summary, or a play comparison table is the document a technical team builds when it has to compare several assets on the same set of criteria, and it is the document a corporate development group reads when it is deciding where to spend.
A table whose rows are questions and whose columns are assets
The screening matrix inverts the usual arrangement. In a production report the rows are entities and the columns are measures, which is the shape every tabular parser is implicitly designed for. In a screening matrix the rows are the attributes under evaluation, things like surface acreage, source rock thickness, depth to basement, thermal maturity, whether geophysical logs exist, whether core is available, and the columns are the assets being compared. The first column is not a label so much as a question, and every cell in the row is an answer to it.
That inversion matters because it changes what a cell means. In a production table, a cell is a measurement with a unit that can be inferred from its column header. In a screening matrix, a cell is an answer whose type is determined by the row, and the rows disagree with each other about type. One row expects acreage in numbers. The next expects a range with a mean and a sample count. The next expects a yes or a no. The next expects a list of counties. The next expects a bibliographic citation. A schema that assumes column homogeneity, which nearly all of them do, has already made the wrong assumption before the first value is read.
Most of the cells are not values
Open one of these matrices and count how many cells contain a clean scalar. It is usually a minority. The rest carry qualified language that is doing real analytical work: unknown, not determined, none reported, probably similar to the adjacent sub basin, shallow and subject to current action, at least four thousand seven hundred feet by drilling, a study in progress at the state survey. Every one of those is a deliberate statement about the state of knowledge, and the difference between unknown and none reported and not determined is exactly the difference a technical reviewer is reading the table to find.
Extraction systems that normalise aggressively destroy that distinction first. Empty, unknown, and not applicable collapse into null, qualifiers get stripped so a range becomes its midpoint, and a cell that said probably becomes a cell that says nothing. What arrives downstream is a matrix that looks more certain than the source document, which in a screening exercise is the single worst direction in which to be wrong.
Grouped headers carry the geology
The header block on a matrix like this is almost never one row. There is a title row naming the compilation and its as of date, a grouping row that gathers several columns under a single basin, and a row of sub basin names beneath it. A column's identity is the concatenation of all three, so a value read under the third column is meaningless unless the system knows that the third column belongs to a particular sub basin which belongs in turn to a particular basin. Merged cells encode that hierarchy visually and nothing else in the document encodes it at all.
This is the span problem in its most consequential form. When a parser reads only the lowest header row, it produces columns labelled with sub basin names that are locally unique but globally ambiguous, and the resulting dataset quietly mixes assets that a geologist would never compare directly. When it reads the merged cell as a single wide column instead of a group, it shifts every value to the right of it. Either way the arithmetic still works and the table still looks like a table.
Multi line cells and the reading order trap
Screening matrices also break the assumption that a cell is a line. Cells here routinely wrap to four or five lines because the answer is a sentence, and adjacent cells in the same row wrap to different depths, so the row is visually tall and internally ragged. Systems that reconstruct tables by clustering text lines horizontally will merge the second line of one cell with the first line of its neighbour, producing a value that is a grammatical fragment assembled from two different columns. The output is not obviously corrupt, which is why it survives review.
Reading order is the related trap. A wide landscape page with a tall header block and ragged rows has no single correct linear order, and a pipeline that flattens it to text is choosing one arbitrarily. The only durable fix is to stop flattening. If every cell carries its own coordinates, its row and column indices, and its span flags, then reading order becomes a rendering decision rather than a data loss event.
Structure first, then the model
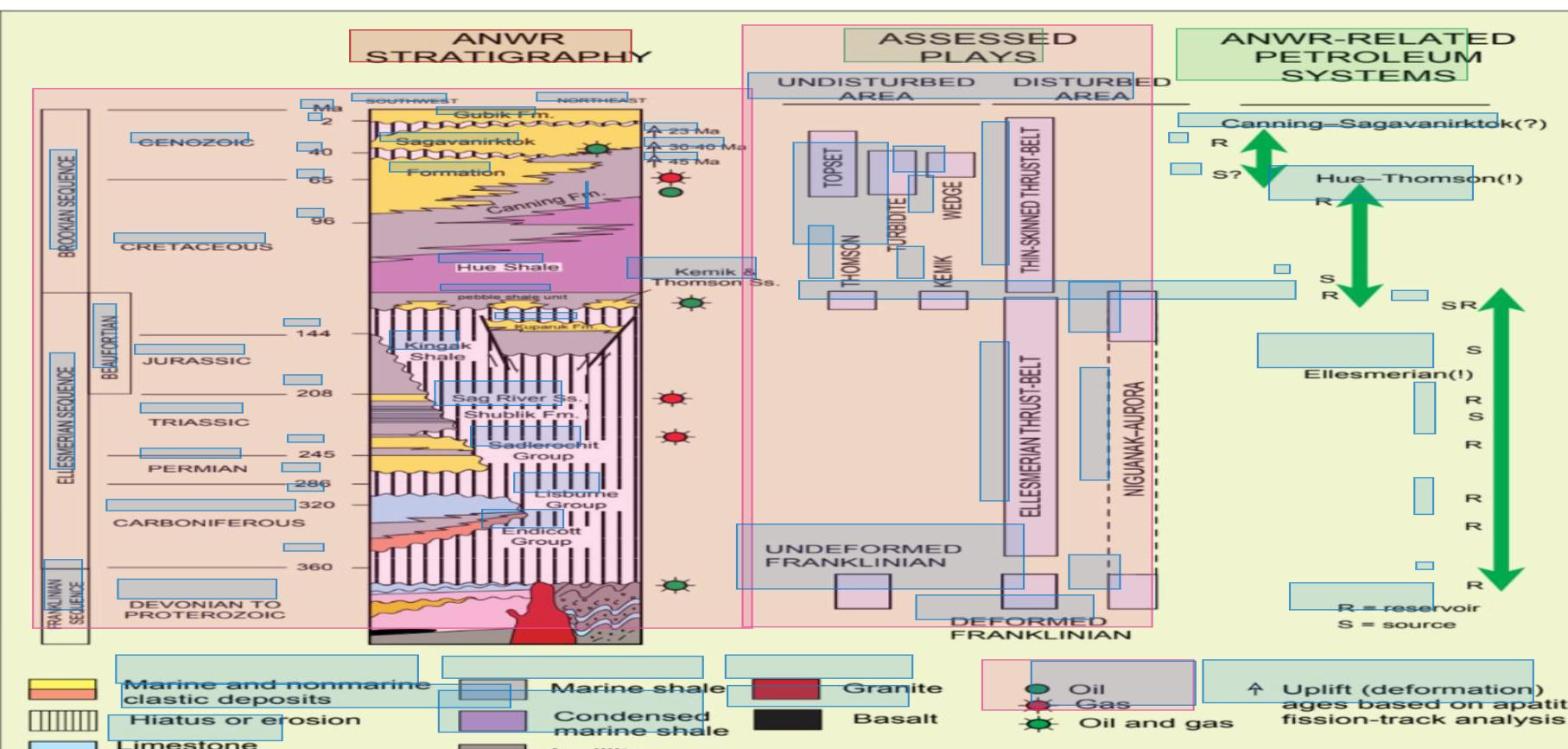
The overlay in the image shows what that looks like in practice. Every cell in the matrix has been located individually, the grouped headers are marked separately from the body, and the table has an explicit boundary rather than being inferred from where the text happens to stop. From that representation, a screening matrix can be loaded into an evaluation model with its qualifiers intact, its hierarchy preserved, and every value traceable to the rectangle on the page it came from.
That traceability is not a nicety in subsurface work. Screening decisions get revisited years later, usually by people who were not in the room, and the question they ask is not what the number was but where it came from and how confident the original compiler was. A document representation that keeps the qualifier, the header path, and the coordinates answers that question. One that returned clean numbers cannot.