


The arithmetic nobody runs
Ask most extraction vendors how accurate they are on financial statements and the answer arrives as a field-level number: 98 percent, 99 percent, sometimes higher. The number is usually true. It is also close to meaningless for the person who has to use the output, because a balance sheet is not consumed one field at a time. It is consumed as a whole, and the whole is only as good as its worst cell.
The math is unforgiving. A combined statement of condition with its accompanying notes carries somewhere between two hundred and four hundred discrete values once every line item, comparative period, subtotal, and footnoted figure is counted. At 99 percent per-field accuracy, the probability that all three hundred of those values are correct is 0.99 raised to the three hundredth power, which works out to about 5 percent. At 99.5 percent, the figure climbs to roughly 22 percent. A credit analyst spreading that statement does not get to keep the 297 correct values and discard the three wrong ones, because they do not know which three are wrong. They have to check all of them, and the moment that is true, automation has delivered a faster transcription and nothing more.
Teams we talk to in lending, portfolio monitoring, and fund administration have arrived at this realization independently and often painfully. Their internal evaluations started with field-level F1 scores in the high nineties, the pilot looked successful, and then the first quarter of production review surfaced the same pattern every time: nearly every document needed a human touch, and the review queue was not shrinking.
Where the misses cluster
If errors were spread evenly across pages, a 99 percent field rate would at least be predictable. They are not. Extraction misses cluster in the parts of a document that are structurally hardest, and those parts carry a disproportionate share of the meaning.
The first cluster is the subtotal hierarchy. Financial statements encode relationships through indentation, bold weight, rule lines, and whitespace rather than through anything a text layer exposes. When an extractor flattens "Total assets" to the same depth as "Loans to depository institutions," the individual numbers may be perfectly transcribed while the structure that makes them a statement is gone. A downstream model that sums the children and compares them to the parent will flag the mismatch, but only if the parent was recognized as a parent in the first place.
The second cluster is the comparative column. Most statements present at least two periods side by side, and many present a current period against a prior year-end and a prior quarter. Column headers are frequently stacked across two or three lines, abbreviated, or shared across a group of columns through a spanning header. The classic failure mode is a column shift: every value in the "December 31" column lands under "September 30," and nothing about the numbers themselves reveals the mistake. Per-field accuracy still scores well because each number was read correctly. It was just assigned to the wrong period.
The third cluster is the long tail of degraded pages. A quarterly report that is born digital will extract cleanly for forty pages and then include a scanned schedule, a chart with the data living in bar heights rather than digits, or a photocopied reconciliation with faded rule lines. In evaluations that score per value, these pages barely move the average. In evaluations that ask whether the document passed, they decide the outcome.
Scoring the way finance consumes
The fix starts with a different question. Instead of asking what fraction of fields were right, ask what fraction of documents were entirely right, with every value in the correct row, the correct column, and the correct level of the hierarchy. Pulse refers to this as the percent-perfect rate, and it is the primary number tracked across PulseBench evaluations on financial documents, because it is the only number that predicts whether a document can bypass review.
Percent-perfect scores are humbling. A system that posts 99 percent field accuracy can post 40 or 50 percent at the document level, and that gap is precisely the information a finance team needs. It tells them that half of their documents will still require a reviewer, and it points directly at the structural failures responsible for the other half. Field-level scores can and should still be reported, but as a diagnostic rather than a headline.
Two consequences follow for how an extraction system is built. First, structure has to be a first-class output rather than something inferred afterward. Every table cell needs a row index, a column index, a span, and a bounding box, so that a parent-child relationship between "Total liabilities" and its components is explicit in the JSON rather than something a downstream script has to reconstruct from indentation. Pulse emits cell-level geometry for every table, including merged cells and gridless layouts, and preserves spanning headers so that column assignment is recorded as a decision that can be audited rather than a side effect that can silently go wrong.
Second, the system has to know where it is uncertain. A calibrated confidence score on every value, one that actually tracks observed accuracy rather than reporting softmax outputs, turns a binary percent-perfect result into a routing decision. Documents where every value clears the threshold flow straight through. Documents with a handful of low-confidence cells route to a reviewer with those specific cells highlighted, which turns a full re-check into a thirty-second spot check. Across the pipelines Pulse supports in lending and fund operations, this is the mechanism that moves the review rate, not an incremental improvement in the field-level average.
What the showcase page demonstrates
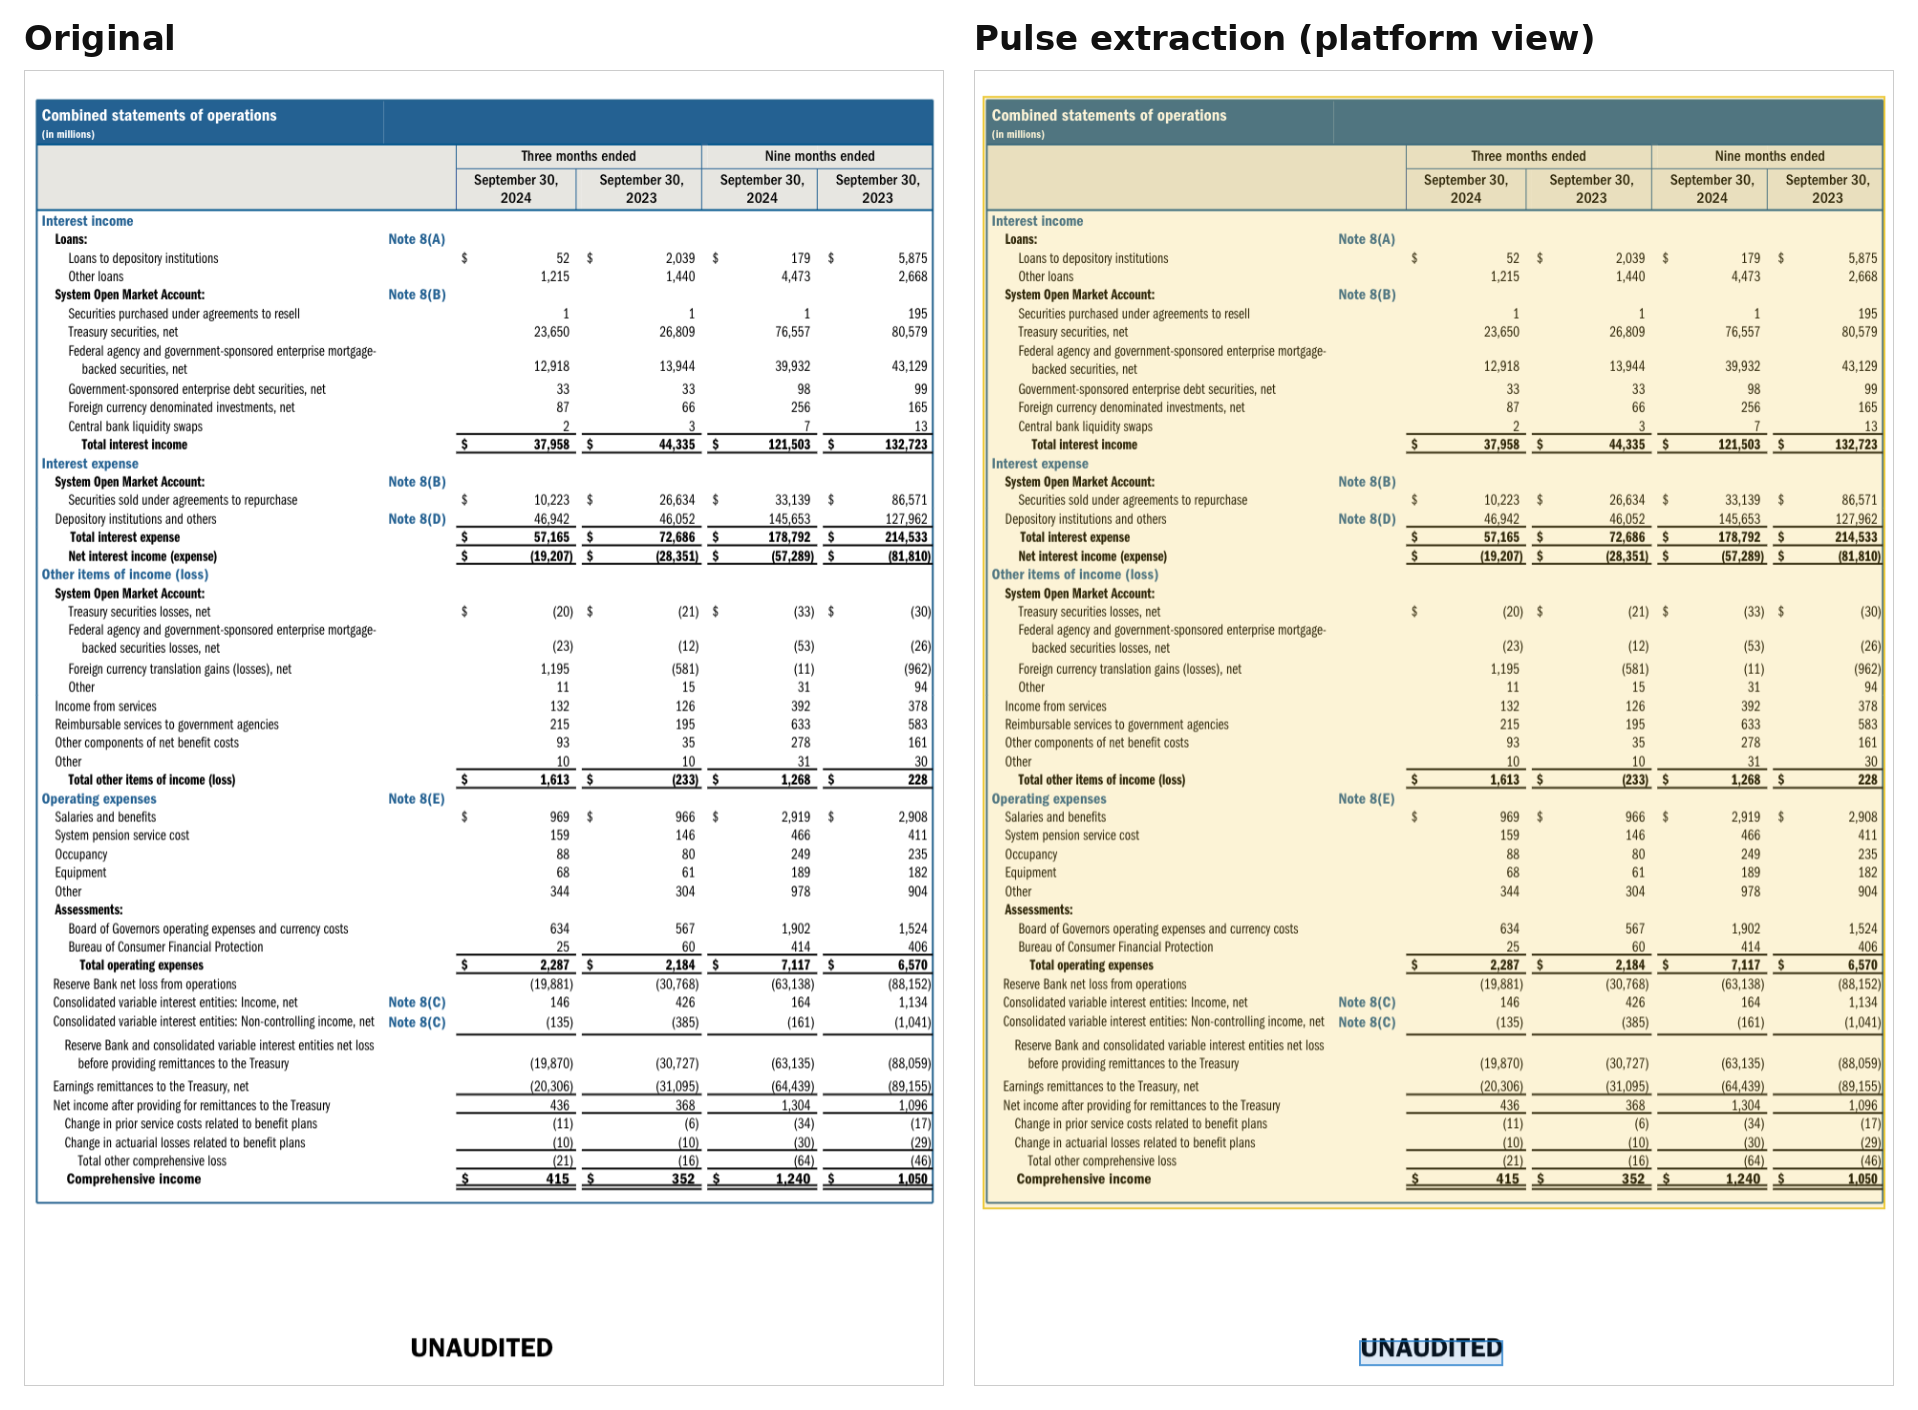
The page below is from a publicly available combined quarterly financial report issued by a central bank, chosen because it packs the hardest structural features of a financial statement onto a single sheet: a deep subtotal hierarchy, stacked comparative columns, and dense numeric cells with parenthetical negatives. The left side shows the original page. The right side shows exactly what Pulse returned, with every table cell drawn from the bounding boxes in the API response. The point to notice is not that the numbers were read, which is table stakes, but that every cell sits in the right column and the hierarchy is preserved across the full width of the table.
Changing the question
Field accuracy is easy to measure, easy to report, and easy to be fooled by. A finance workflow does not run on fields. It runs on statements that reconcile, periods that line up, and totals that equal the sum of their parts. Measuring extraction the way the work is actually consumed is the only way to know whether the document can be trusted, and it is the measurement Pulse holds itself to.


