The package is a set of documents that describe the same building
A commercial real estate loan file rarely arrives as one document. It arrives as a package: a rent roll, a trailing twelve month operating statement, a stack of leases or lease abstracts, an appraisal, a set of borrower financials, the property tax bill, and the insurance certificates. Each of these was produced by a different party, in a different system, on a different date, and each describes the same building from its own angle. The rent roll says what the tenants are supposed to pay. The operating statement says what the property actually collected and spent. The leases say what was agreed. The appraisal says what the market thinks the space is worth and lists the comparables that support that opinion.
Underwriters do not read these documents once. They read them against each other, because the point of the exercise is to find out whether the numbers agree, and if they do not, why. That is the part of the workflow extraction alone does not solve, and it is the part teams we talk to keep asking about once the extraction itself is working.
Every important number appears more than once
Consider net rentable area. It appears on the rent roll as a per-unit figure, in the appraisal as a building total, on the tax assessor's record as a taxable footprint, and inside each lease as the premises description. These four figures should agree, and frequently they do not, because one measures gross area, one measures rentable area, and one was rounded by whoever typed it into a spreadsheet in 2019.
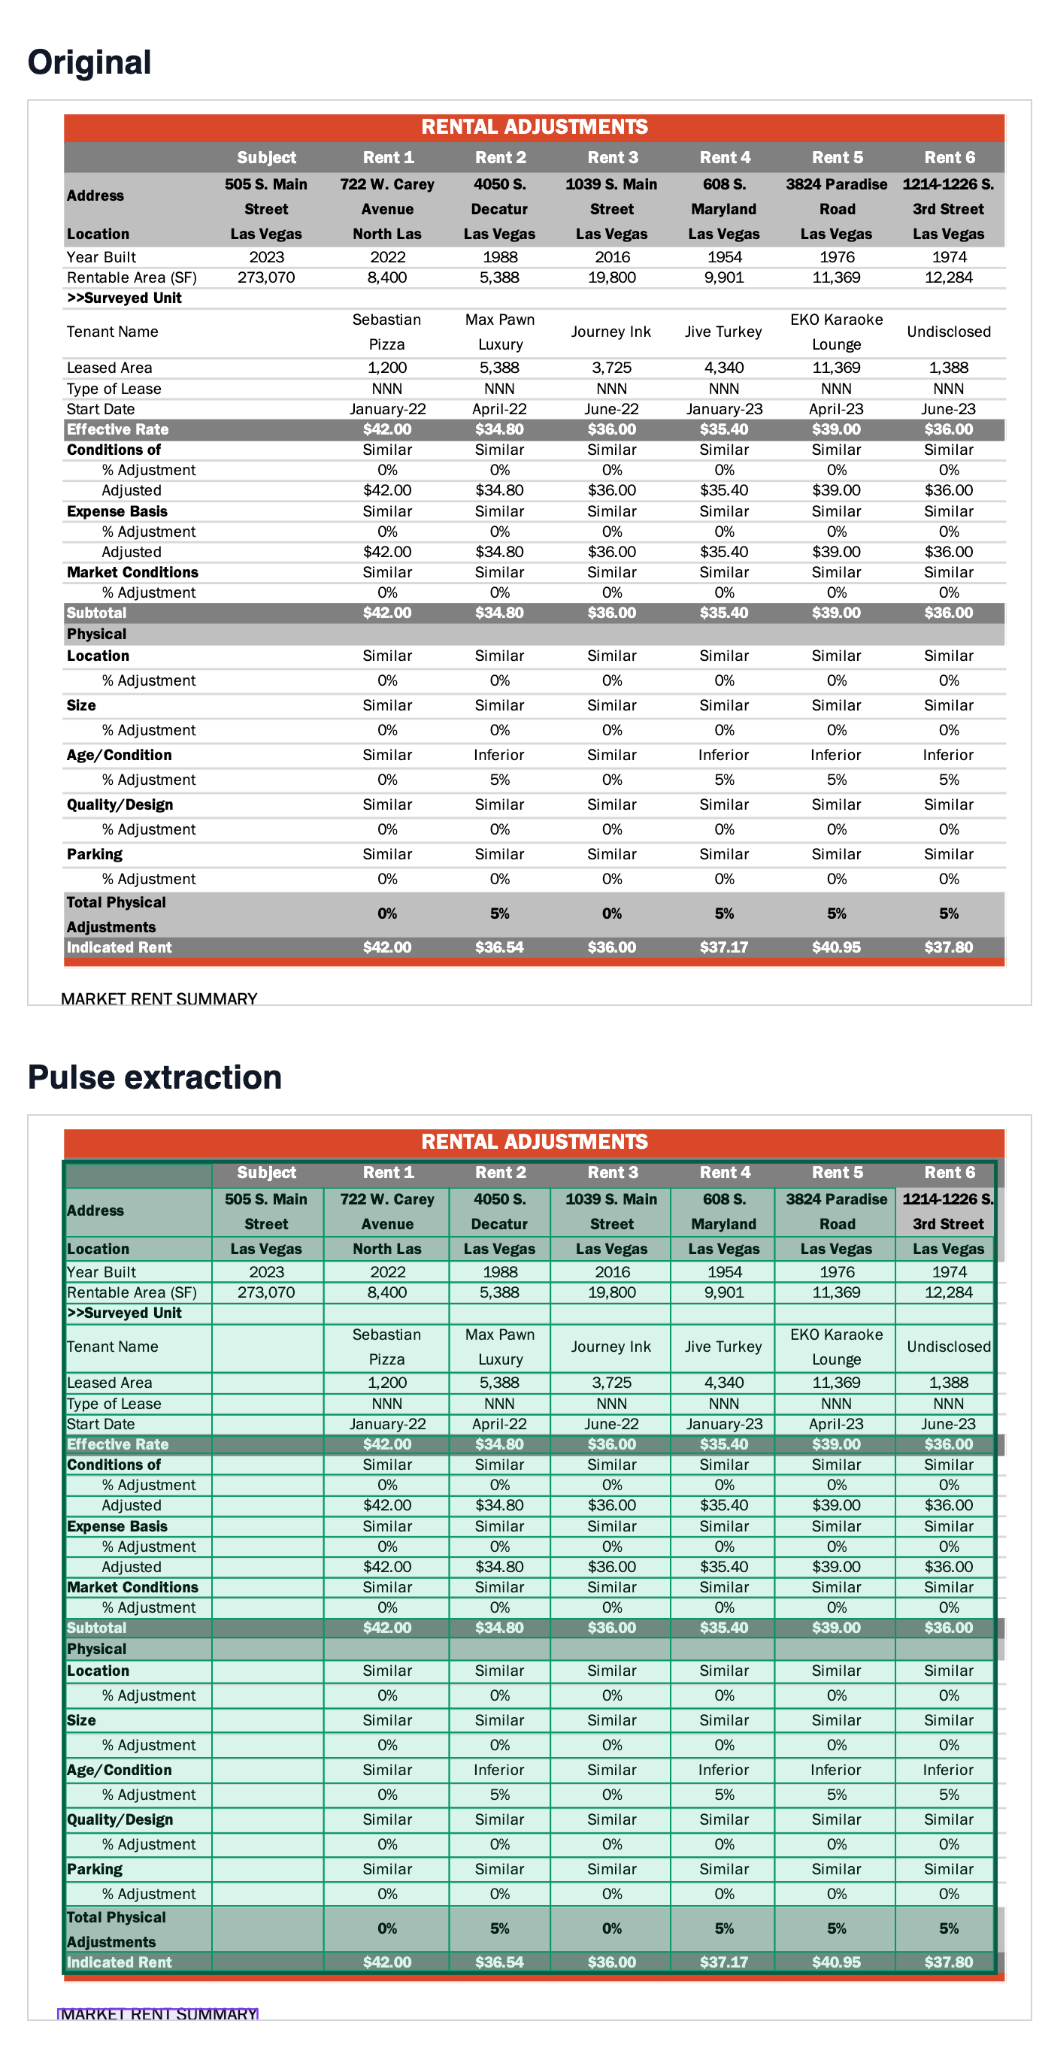
Rent is worse. A rent roll may show monthly base rent in one column and annualized rent in another, or show one of the two and label it ambiguously. The operating statement reports gross potential rent, collected rent, and vacancy loss on a basis the rent roll never states. The lease specifies a rate per square foot on a triple net basis with fixed annual escalations, so the figure that should appear on the rent roll depends on when the roll was generated and whether the latest escalation has been applied. The appraisal's comparable grid then shows what other landlords charge for similar space, which is how the lender judges whether in-place rents are sustainable.
None of these documents is wrong. They measure different things at different times, and the underwriting question is whether the differences are explained. A rent roll showing a unit at $3,000 per month while the lease says $2,900 with a 3 percent bump last quarter is consistent. A rent roll showing $3,000 while the operating statement's collected rent implies $2,400 for that unit is a variance that needs a story, and the story might be a concession, a delinquency, or a typo.
Where extraction stops and reconciliation begins
Structure-preserving extraction is the prerequisite for any of this. If the rent roll's blank cells are not preserved as blanks, vacant units silently disappear from the occupancy calculation. If a multi-page rent roll is not merged into one table, the totals row on the last page is orphaned from the rows it sums. If the operating statement's nested line items lose their hierarchy, repairs and maintenance ends up inside real estate taxes and the expense ratio moves by a few points without anyone noticing. Pulse handles those failure modes at the extraction layer with cell-level bounding boxes, spanned table merging, and native merged cell handling, and that layer is where most vendors stop.
Reconciliation is the stage after that, and it has its own failure modes. Entities must be aligned across documents: unit 204 on the rent roll, "Suite 204" in the lease, and "Unit 204/205 (combined)" in the appraisal are the same space or two spaces depending on when a wall came down. Units must be normalized: monthly to annual, per square foot to total, cash to accrual where the documents allow it. Comparisons need tolerance bands, because a $12 rounding difference is noise while a $1,200 difference is a finding. And every variance needs a source on both sides, meaning the exact cell on the rent roll and the exact line on the operating statement, so a reviewer can click through to the page rather than reopening the PDF and hunting.
That last requirement is why word and cell level bounding boxes matter beyond auditability. A reconciliation table that lists variances without coordinates is a to-do list. A reconciliation table where each side of the variance is anchored to a location on the source page is a review interface, and the difference in time to close is measured in hours per file.
Why the loan sizing depends on it
Debt service coverage, debt yield, and loan to value all flow from net operating income, and net operating income is a small number produced by subtracting two large numbers. A misaligned column on the operating statement, or an annualized figure read as monthly on the rent roll, does not produce an obviously absurd result. It produces a plausible NOI that is off by a few percent, which moves the sizing, which either leaves proceeds on the table or puts a loan on the books that would not have passed committee with the correct figure. The lender's exposure is not to the extraction error itself but to the fact that the error was consistent enough to look right.
Reconciliation catches this because the same figure has to survive contact with three or four independent sources. The rent roll's gross potential rent has to sit within a defensible band of the operating statement's, the operating statement's occupancy has to match the rent roll's vacancy count, and both have to be consistent with the lease terms. When they line up, the underwriter can spend their time on judgment. When they do not, the pipeline has already pointed at the cells that disagree.
What we are building toward
Teams tell us, in nearly every conversation about lending workflows, that the deliverable they want is not a JSON object per document but a matched view across the package with disagreements surfaced and sources one click away. Pulse provides the extraction layer that makes this possible: tables that come out as tables with every cell located on the page, footnotes attached to the values they qualify, schema-guided output that maps a rent roll and an operating statement to the same field names, and confidence scores calibrated to observed accuracy rather than model enthusiasm. The reconciliation layer is where lending teams turn that output into decisions, and it works only when every input carries its own coordinates.