A general rate case is the single most consequential document package a regulated utility produces, and it is also one of the hardest to turn into data. A typical filing runs to thousands of pages: an application, direct testimony from a dozen witnesses, workpapers, and an appendix of exhibits where the actual numbers live. Commission staff, intervenors, rating agencies, and the utility's own regulatory affairs team all need the same thing from that package, which is a clean, traceable set of figures they can model, compare across cases, and defend. Most of them still get there by hand, because the exhibits were built for a hearing room rather than a database.
Teams we talk to in the sector describe the same pattern: the filing arrives as a PDF, an analyst opens the revenue requirement summary, and the re-keying begins. This post walks through what makes those exhibits structurally difficult and how Pulse reads them so that the structure survives.
The revenue requirement summary is a table about tables
Open the appendix to any adopted rate case decision and the first exhibit is usually a summary of the revenue requirement by line of business across the rate case cycle. A representative version has fifteen columns: a line number, a description, the adopted base year, and then for each of four forward years a dollar figure, an increase over the prior year, and a percentage change. Beneath the column headers sits a second header row of formula references, with entries such as (c) equals (b) minus (a), telling the reader how each derived column was computed.
Every one of those features defeats a naive parser. The two-tier header means the column labeled "Increase" only has meaning in combination with the year above it. The formula row is not data, but it is also not noise, since it documents which columns are inputs and which are outputs, and a model that treats a derived column as an independent input will double count. Dollar signs appear on the first row of each block and vanish beneath, parenthesized negatives and footnote markers attach to specific cells, and the totals row is bold rather than labeled.
Pulse returns this exhibit as a single table object with cell-level geometry: every cell carries its row and column position, its text, a confidence score, and a bounding box on the page. Both header rows are preserved as headers, which is what allows a schema to map "2025, Increase (decrease)" to one field and "2025, % Increase" to another, and the formula references ride along as cell text so the modeler can see exactly how the exhibit was built.
Cost of service studies invert the shape
A cost of service study allocates the revenue requirement across customer classes, and its summary table runs the other direction. Rate classes become columns, with residential, small, medium, and large general service, large power, lighting, and often a special contract or two spread across the page, while the rows carry revenue requirement, revenue at current rates, class deficiency, and the indicated percentage adjustment. A ten-column table with six rows is small, but the semantics are dense: the deficiency row mixes positive values with negatives in parentheses, the adjustment row is a percentage while every row above it is dollars, and a reallocation row often spreads one class's shortfall across the others, so a totals check only balances once that reallocation is included.
These tables are frequently pasted into testimony as images from a spreadsheet, which means there is no text layer at all. Pulse's vision models read the image directly, recover the grid, and emit the same structured table output they would for a native PDF.
Tariff schedules encode rules, not just prices
Rate design exhibits and the tariff sheets that follow them are where extraction errors become billing errors. A single rate schedule can carry a customer charge, a facilities charge that differs for secondary, primary, and substation service, a demand charge that applies only above a threshold, and an energy charge with seasonal blocks and an hours-use-of-demand structure where the price steps down after 300 hours per kilowatt. The table on the page looks simple. The logic it encodes is a small program.
What matters for extraction is that the rules are expressed through layout. Indentation under a charge name signals that the rows beneath are blocks of that charge. A column header reading "Summer (June to September)" governs every value under it until the next header. A footnote marker on the demand charge points to the eligibility condition at the bottom of the page. Pulse preserves these relationships, including the footnote link from the cell to its referenced text, so the output can be mapped into a rate engine without a person re-deriving the structure from a flattened text dump.
Interconnection agreements and the exhibits nobody reads until they must
Generator interconnection agreements bury their economics in appendices: a schedule of milestones with dates and security amounts, an itemized estimate of network upgrade costs with responsibility split between the interconnection customer and the transmission owner, and a one-line diagram that is a drawing rather than a table. The milestone schedule benefits most from typed extraction, with dates returned as dates, dollar amounts as numbers, and the responsible party as a categorical value, because that is how the downstream tracking system wants them. Pulse's schema-driven extraction lets a team define those types once and apply them across every agreement in the portfolio, with each value grounded to its location on the page.
Why confidence has to travel with the number
The common thread across these documents is that each extracted value will be reviewed by someone whose job depends on it being right. Customers have told us that the review step is where document projects stall, not the extraction step, because reviewers shown a flat list of fields end up checking all of them.
Pulse attaches a calibrated confidence score to every cell and every field. That is what makes a review queue tractable: an analyst can sort by confidence, spend attention on the handful of cells where the model was uncertain, and accept the rest with a bounding box link back to the page as the audit trail. The threshold where accuracy begins to fall off emerges from production usage over a few cycles rather than being known on day one, which is why confidence needs to be a first-class output of the extraction rather than an afterthought.
What this looks like in practice
The image below shows a page from a public rate case decision appendix, with the original on top and the Pulse extraction below. Every cell in the fifteen-column revenue requirement summary is recovered with its position in the grid, including the two header rows and the formula-reference row, and every box drawn on the page comes directly from the API response. That is the difference between a document that can be read and a document that can be used.
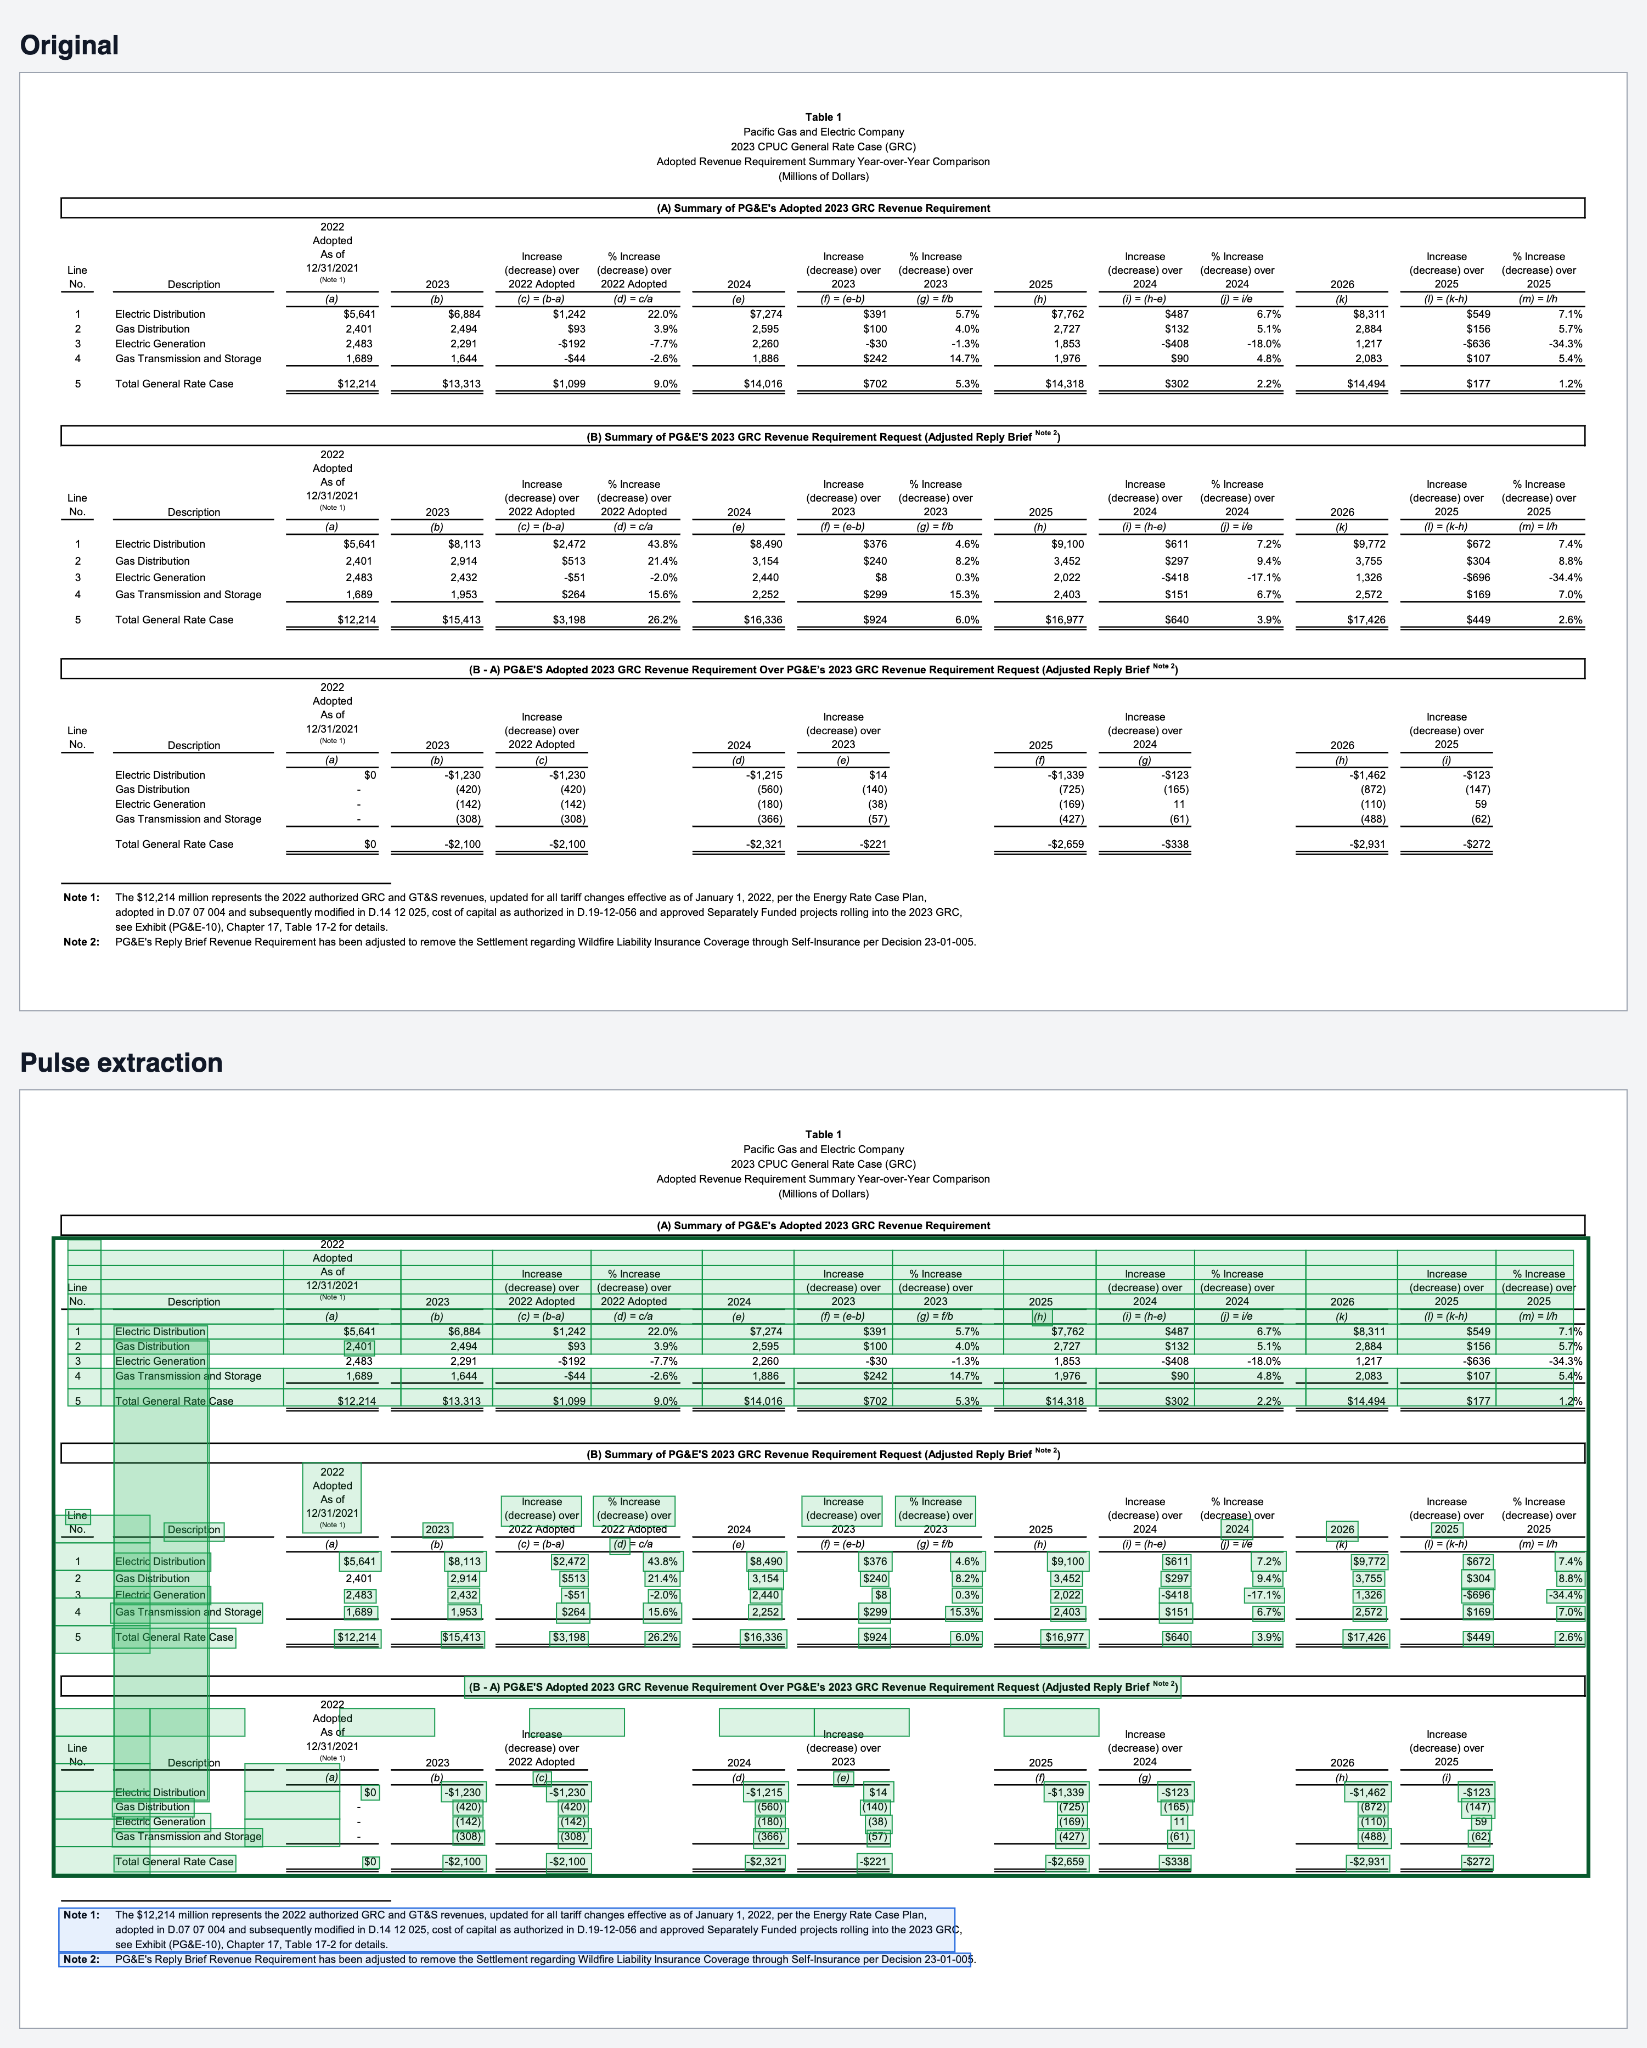
table from a public rate case decision appendix on top, and the same page below with Pulse's extracted table cells drawn as green boxes inside a dark green table border, text blocks in blue, and headers in purple.
Regulated utilities will keep producing documents designed for commissions rather than for machines. The work is to read them without losing what the layout was saying.