When Agentic Chart Reconstruction went live, our ambition was to help our partners unlock data where legacy scan formats made extraction difficult and information unreliable. Since then, we’ve seen the feature process Pulse’s most complex inputs across oil and gas, financial services, and more.
The Challenge: Scanned Well Logs to LAS Files
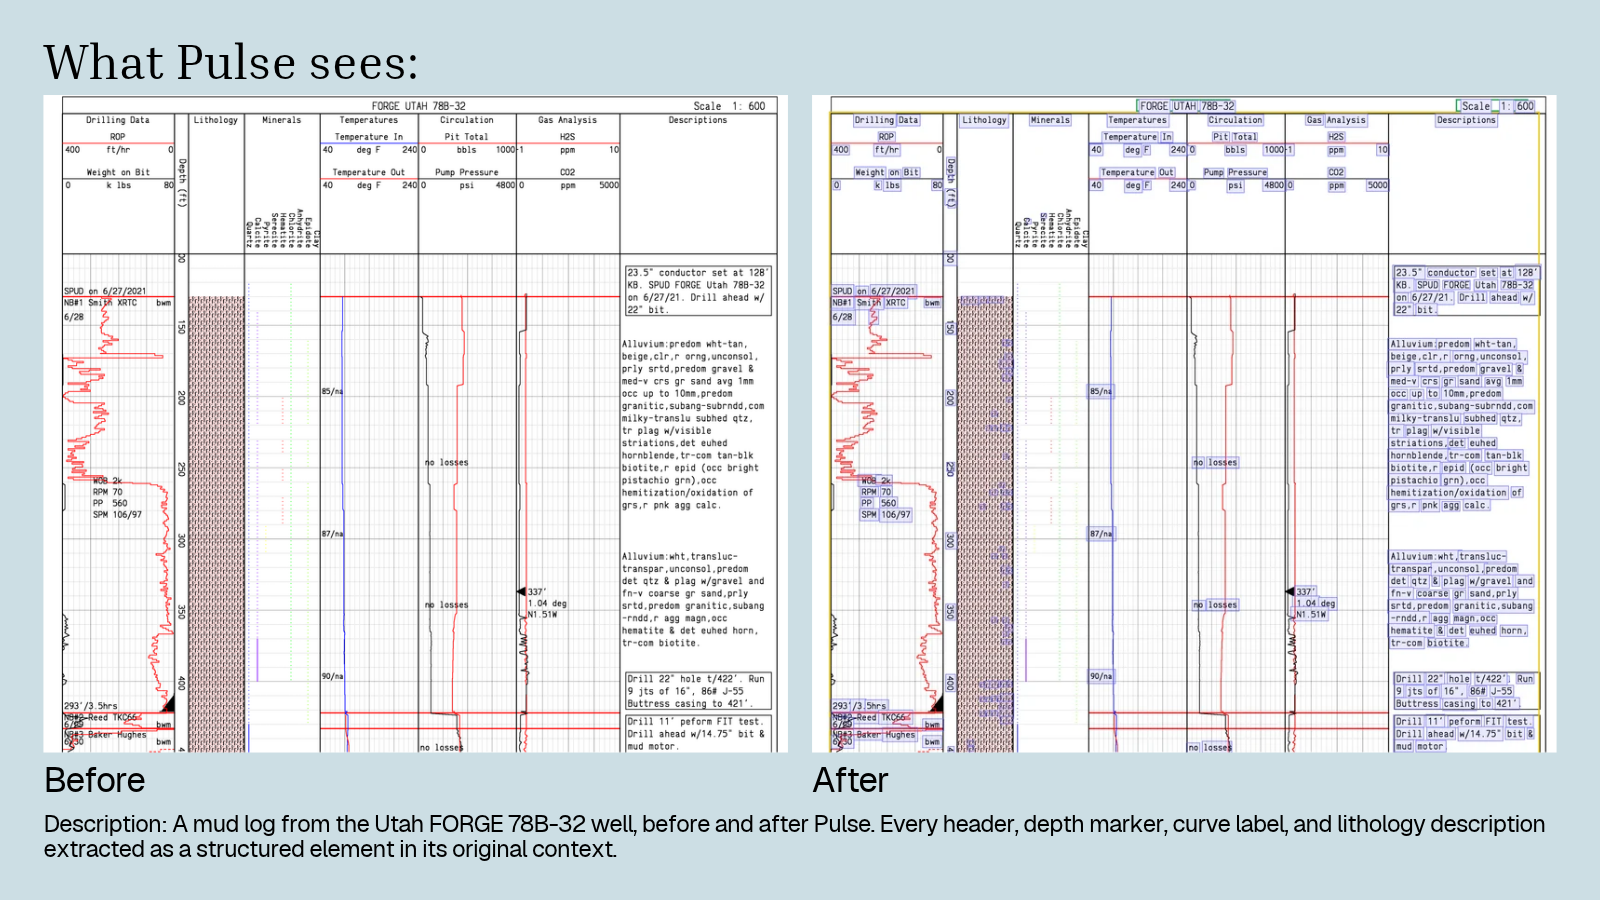
Historical well logs are mostly scanned curves rather than numbers, and chart reconstruction pulls thousands of aligned, depth-indexed values out of a single scanned log and exports them as LAS files, so decades of legacy subsurface data can move straight into the software geologists already use.
That matters because a scan only preserves the picture of a well log, not the data in it. A geoscientist can read a log in seconds, but the values sit in the position of each curve inside a narrow track, measured against a scale printed beside it or between neighboring tracks. Well log digitization has meant opening each image, setting the depth range and scale for every track, and tracing curves by hand. That works for one well. It does not work for an archive.
Pulse reconstructs every track onto a shared depth grid and follows each curve separately, including where colored or shaded curves overlap and cross. The output keeps each curve's color, line style and legend alongside its values, so the result reads the way the original log does.
What has improved since the launch
Since the launch, we've shipped improvements across every stage of the pipeline, from chart detection and axis calibration to curve tracing and legend matching, while using our VLMs far more selectively so reconstruction is faster and cheaper at scale.
Much of that work was driven by our oil and gas and energy partners, whose historical well logs and technical scans are some of the hardest documents we've seen anywhere in the enterprise. For them, we've retrained our tracing models on degraded multi-curve logs, built a new agentic orchestration layer that zooms into hard regions on demand, and added depth-grid alignment with direct LAS export.
Every extracted value traces back to the source
Chart data extraction is only useful if someone can check the result. Every recovered point stays tied to the chart's location in the original document. In the Pulse platform, a reviewer can view the source and the reconstruction side by side, move along a curve, inspect the values, and return to the figure on the page. Through the API, each chart result includes its type, series metadata, reconstructed points and source location, and teams can choose how many points to return.
Frequently asked questions
Can you extract data from a chart image? Yes. Pulse recovers the underlying values, series and axis scales from line, scatter, bar, pie, donut and well-log charts, including charts inside scanned PDFs, and returns them as JSON, Excel or CSV.
Does chart extraction work on old or low-quality scans? Yes. The models were trained on real, degraded documents alongside synthetic charts, and since launch the tracing models have been retrained on degraded multi-curve well logs. Difficult regions are re-inspected at higher resolution on demand.
How do I verify the extracted values? Every value is linked to its location in the source document, and the Pulse platform shows the original chart and its reconstruction side by side.
Try today on your hardest charts
Agentic Chart Reconstruction is available now in the Pulse platform and API. Bring a scanned well log or a chart-heavy report, read the API documentation, or contact our team to test it on your own documents.